[vc_row][vc_column][vc_column_text responsive_align=”left”]
What does Doctor Copper say about global economic growth, and should we listen?
Mining macroeconomic data for insights into Arizona’s copper industry
Tyler Scott, Research Analyst at Versant Capital Management, Inc.
A brief history of copper
There is archaeological evidence that copper was one of the first metals used as currency by humans nearly 10,000 years ago (8000 BC). By 4000 BC humans learned that when copper is mixed with tin (alloyed), it produces bronze, a material harder and stronger than copper. Bronze was mainly used in weapons and tools and was instrumental in providing societies with a competitive advantage over their peers, thus ushering in what is known as the Bronze Age. Copper remained in use around the world well into the 18th century (Dartmouth Toxic Metals, 2018).
Figure 1- Hamelin de Guettetlet
In the late 18th and early 19th centuries, many intellectual breakthroughs took place in the fields of electricity and magnetism that set the foundation for the modern copper industry. Famous scientists such as Ampere, Faraday, and Ohm were instrumental in identifying copper’s potential as a conductor of heat and electricity. These properties helped launch the industrial revolution and enabled societies to benefit from technologies that considerably increased people’s standards of living (electricity, computers, telecommunications, and transportation). Technology today is continuing to become more electrified, with legacy industries such as transportation and electric generation transitioning toward ways to help mitigate carbon footprints, and a reliance on copper will be key to its success.
Doctor Copper
“Doctor Copper” is a nickname that economists use to describe the material’s ability to “diagnose” global economic growth trends through price movements. They claim that copper has a PhD in economics and deserves the title to tout its valuable insights about the global economy. Why? Because increased global copper demand indicates that economies are investing in infrastructure and technologies that are associated with future growth. Without copper, the developed world would not have achieved the vast economic productivity gains it has since the industrial revolution. It’s also important to understand the supply and demand metrics of the copper price, as mine overproduction or impairments can have significant impacts to the copper price that are unrelated to global economic growth. So, what does Dr. Copper have to say about this growth? Let’s explore.
Global copper mining industry overview
Figure 2- International Copper Study Group
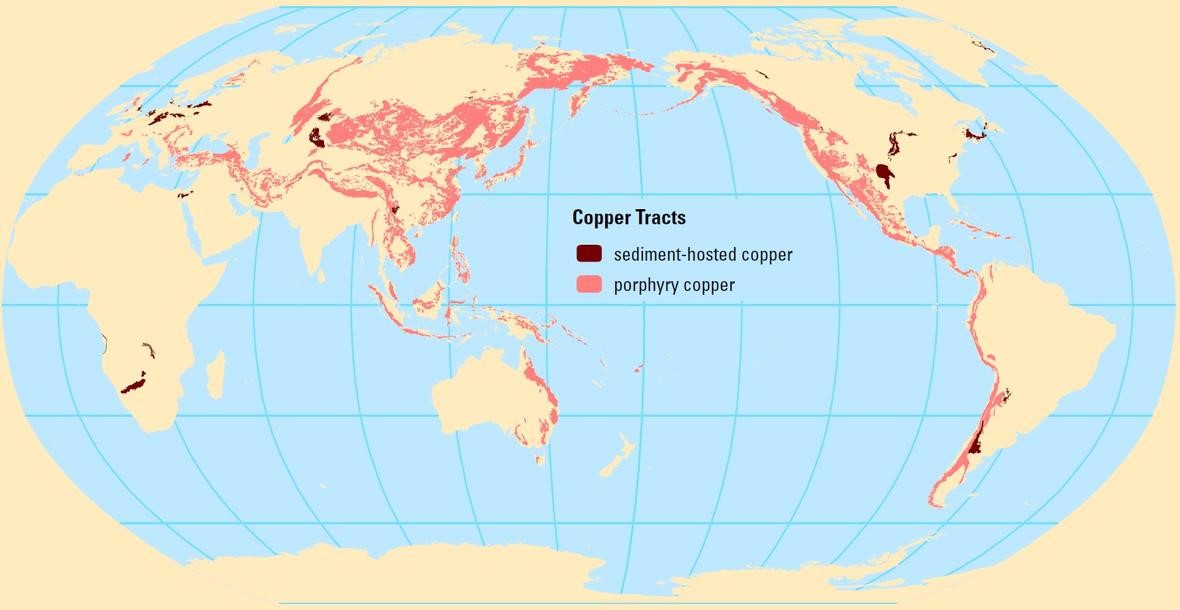
Copper deposits are found throughout the world and are classified based on their geologic setting:
The majority of global reserves and mine production are attributable to porphyry deposits (International Copper Study Group, 2017). Porphyry deposits are a result of plate subduction, and almost all of the largest deposits of this type are found in the mountainous regions left behind by the subduction process.
Figure 3- United States Geological Survey, 2016
Arizona is home to the majority of America’s copper production (approx. 66 percent), and almost all of the deposits that are mined here are porphyry (United States Geological Survey, 2015). While a number of Arizona mines have been in existence for decades and are nearing the end of their life, others are in the developmental stages and should help the state remain the U.S. copper king (Arizona Geological Survey, 2018). As a result of its copper reserves, Arizona is second only to Nevada regarding the current economic value of non-fuel mineral reserves (United States Geological Survey, 2015).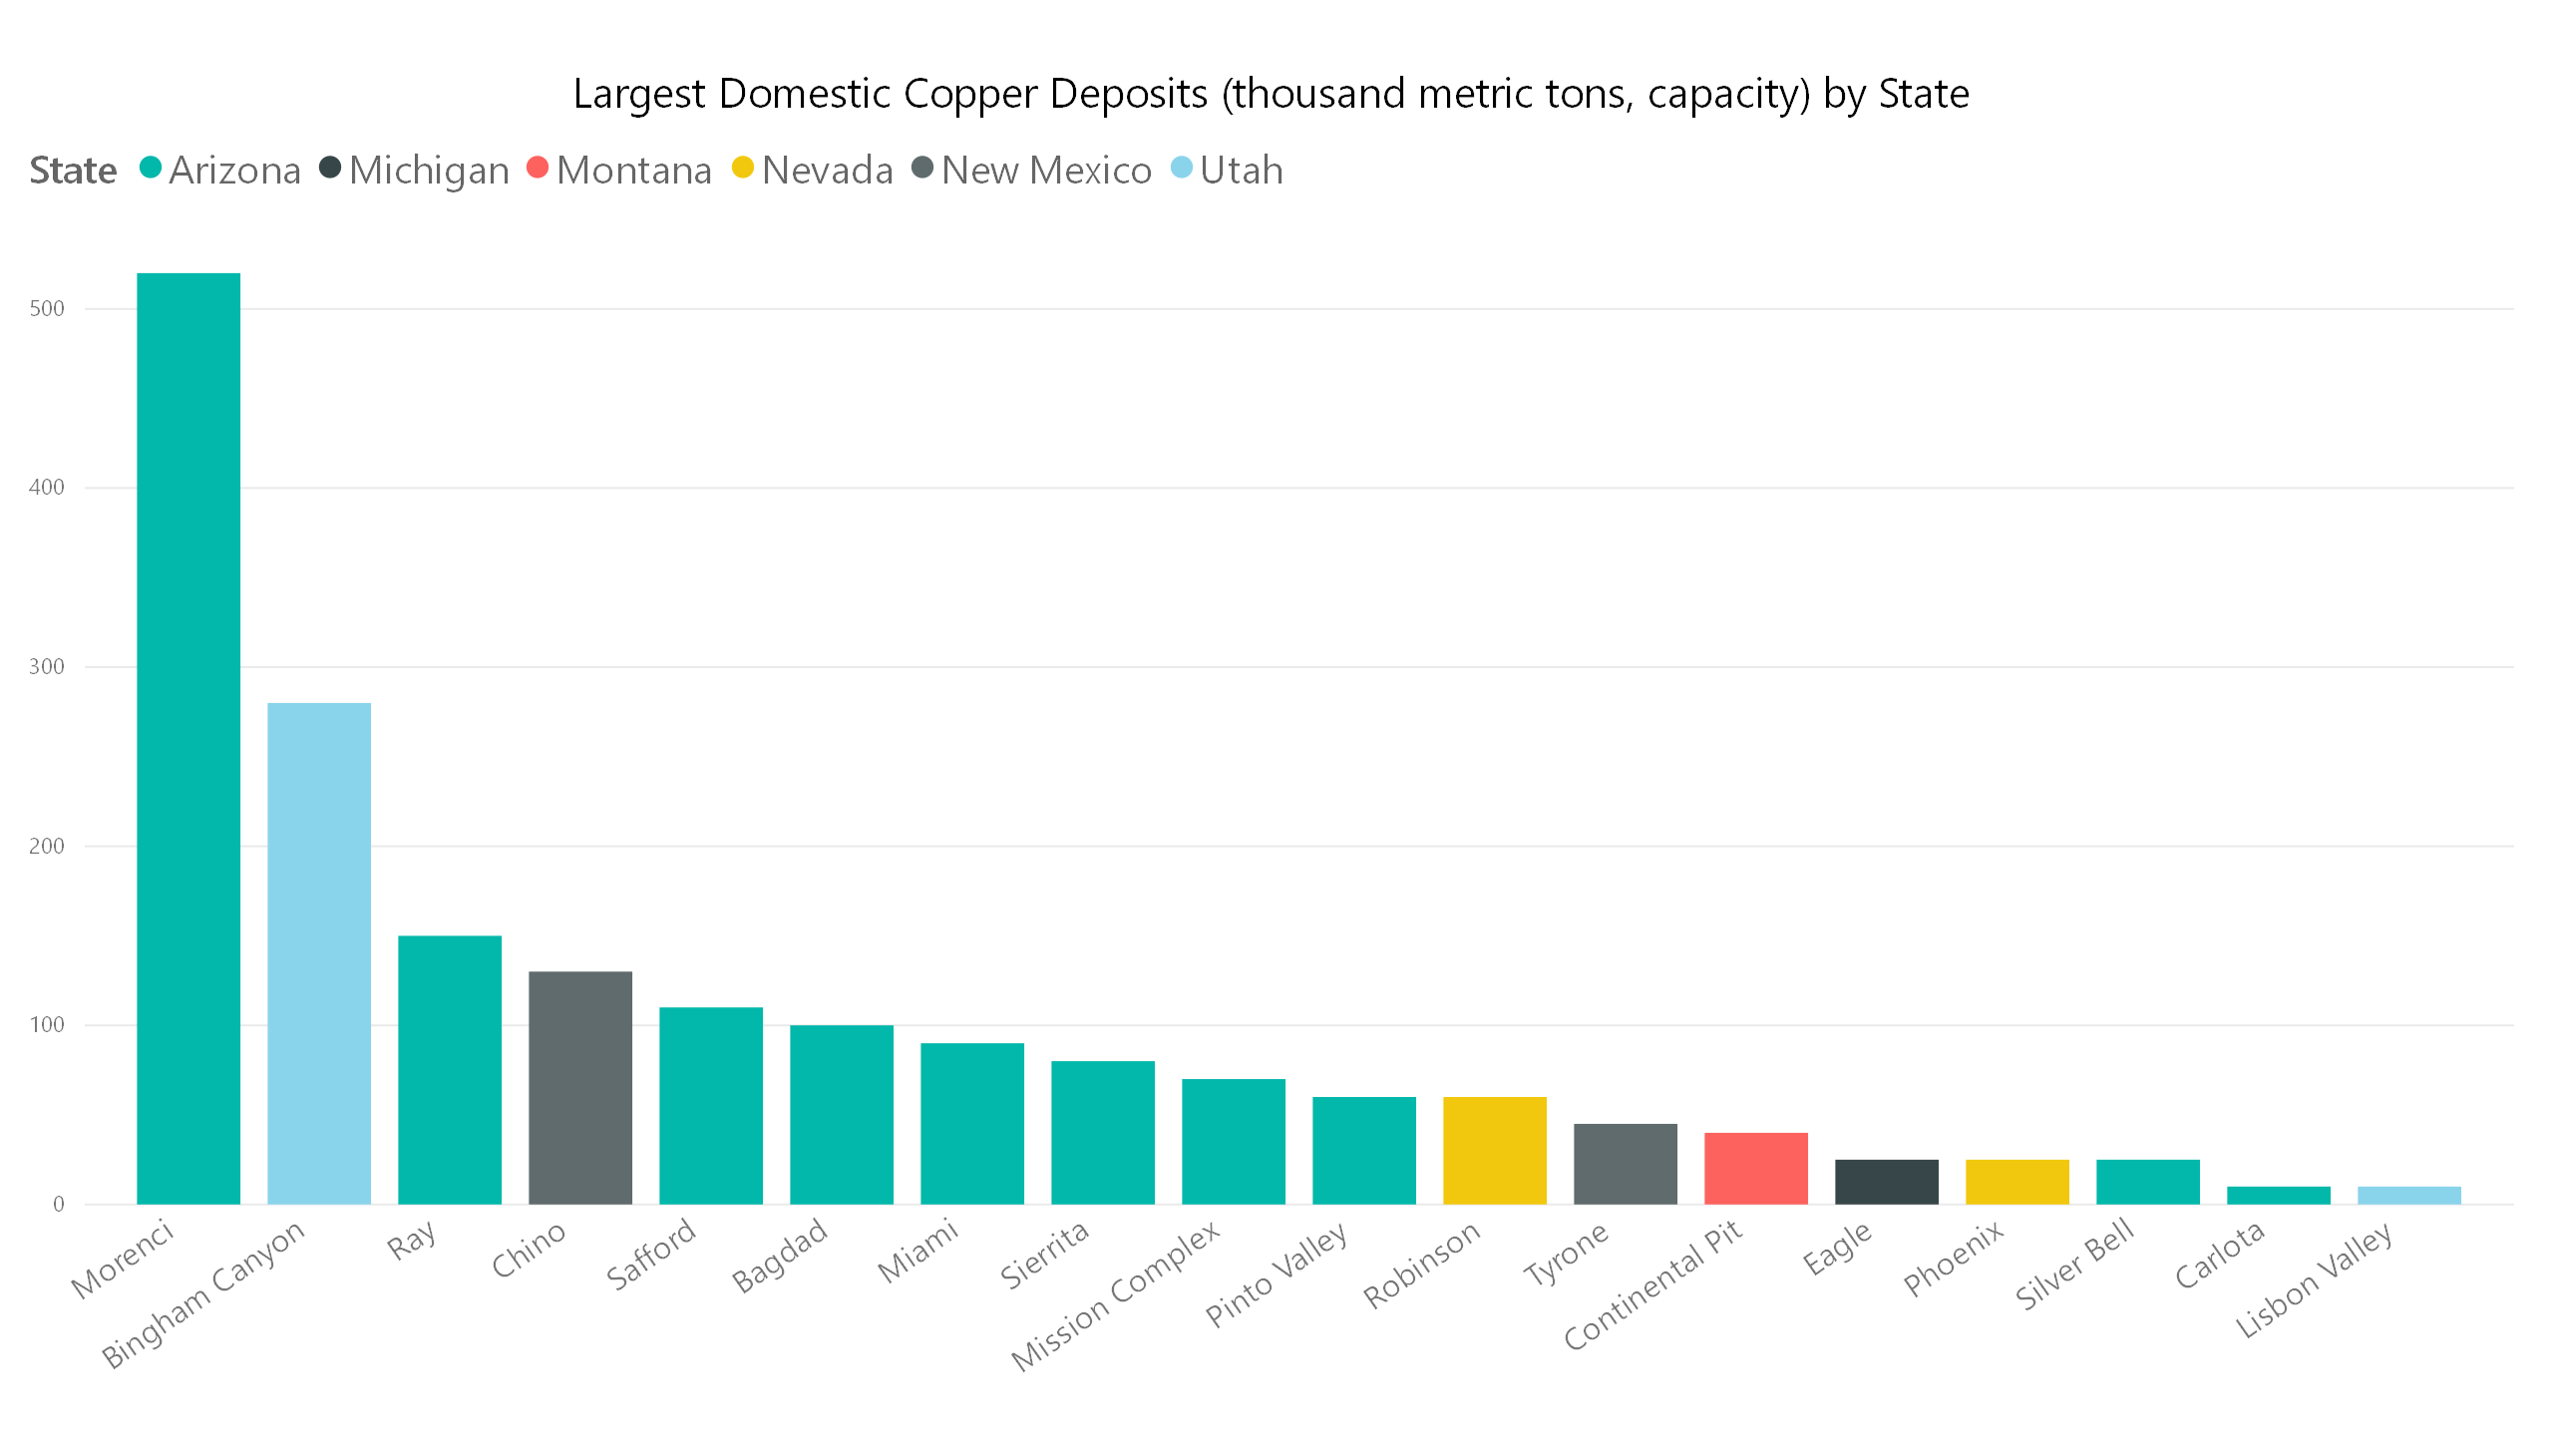
Figure 4- United States Geological Survey, 2015
From a global perspective the majority of mined production comes from other porphyry regions around the world (International Copper Study Group, 2017). In particular, Chile and Peru with their Andean real estate are critical players in the global copper market, where large deposits have helped support these countries’ economic growth.
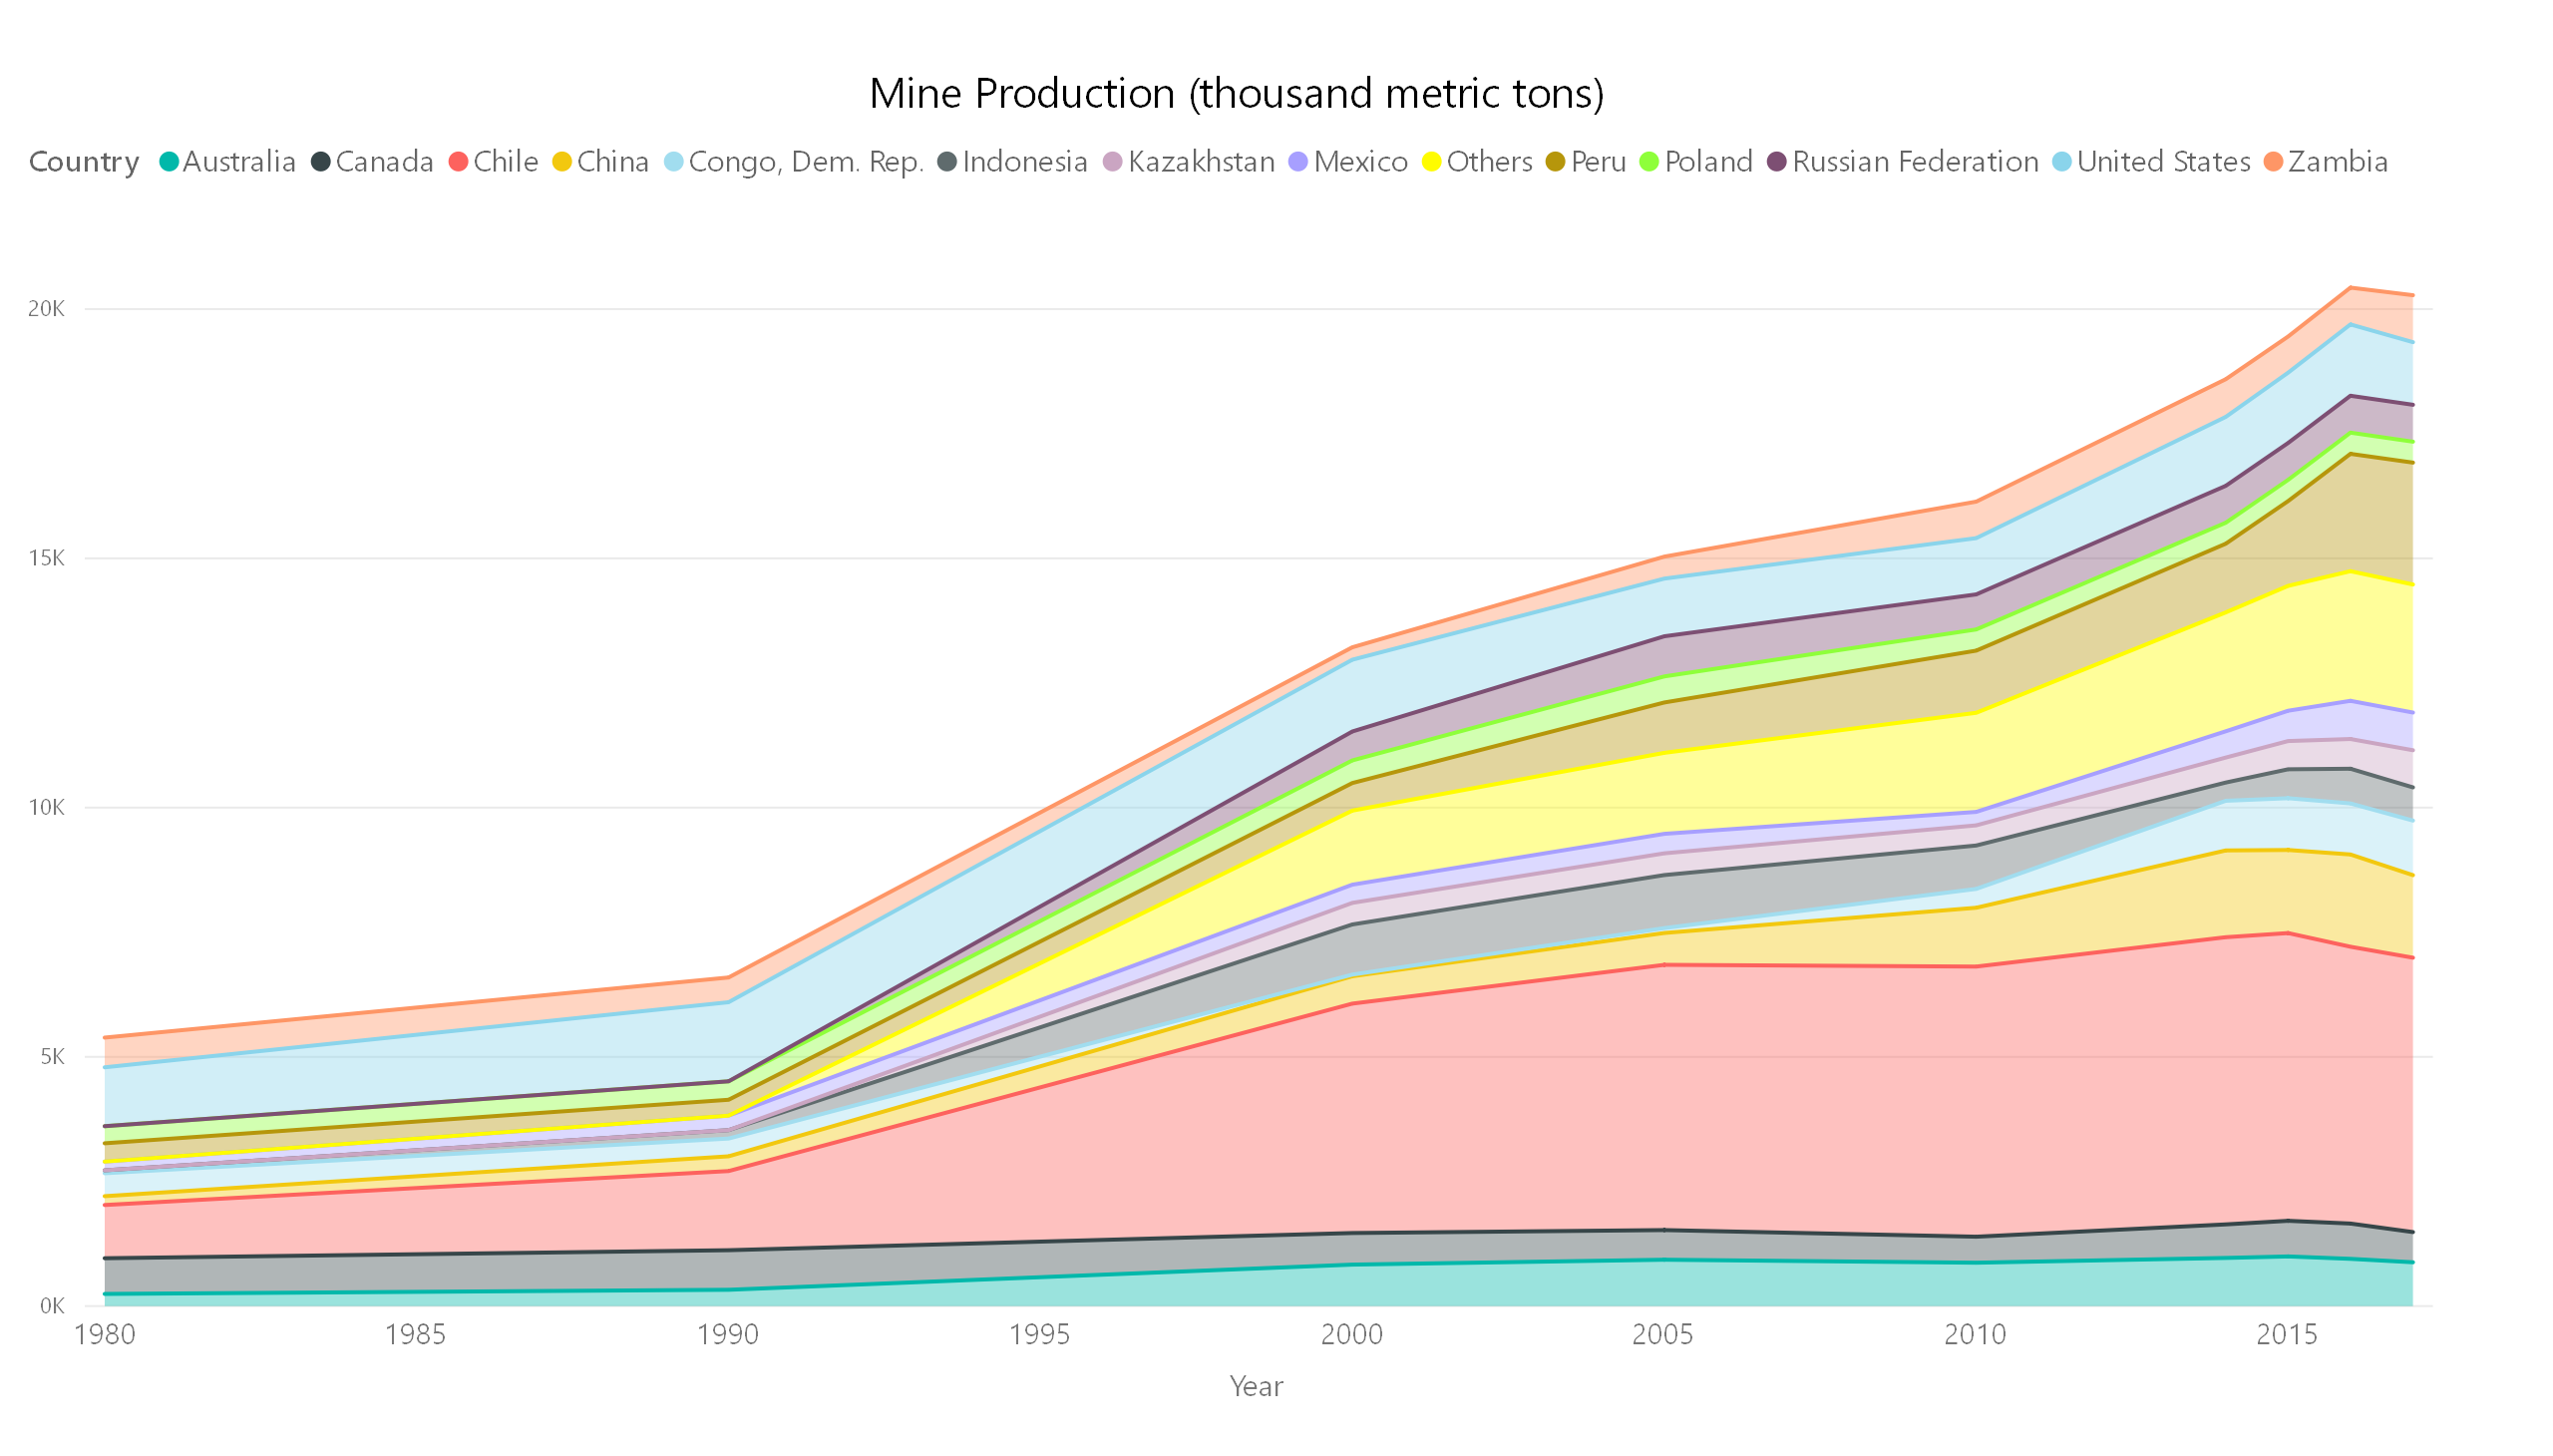 Figure 5- International Copper Study Group
The top ten most productive copper mining countries include Congo DR and Zambia, which have strata-bound deposits. Their influence on the global copper market is growing and should help support their economies (if corruption is kept to a minimum). These central-Africa strata-bound deposits are particularly interesting because cobalt is mined as a byproduct. A mineral required in new battery technologies, cobalt’s importance will continue to grow as we look toward further electrification.
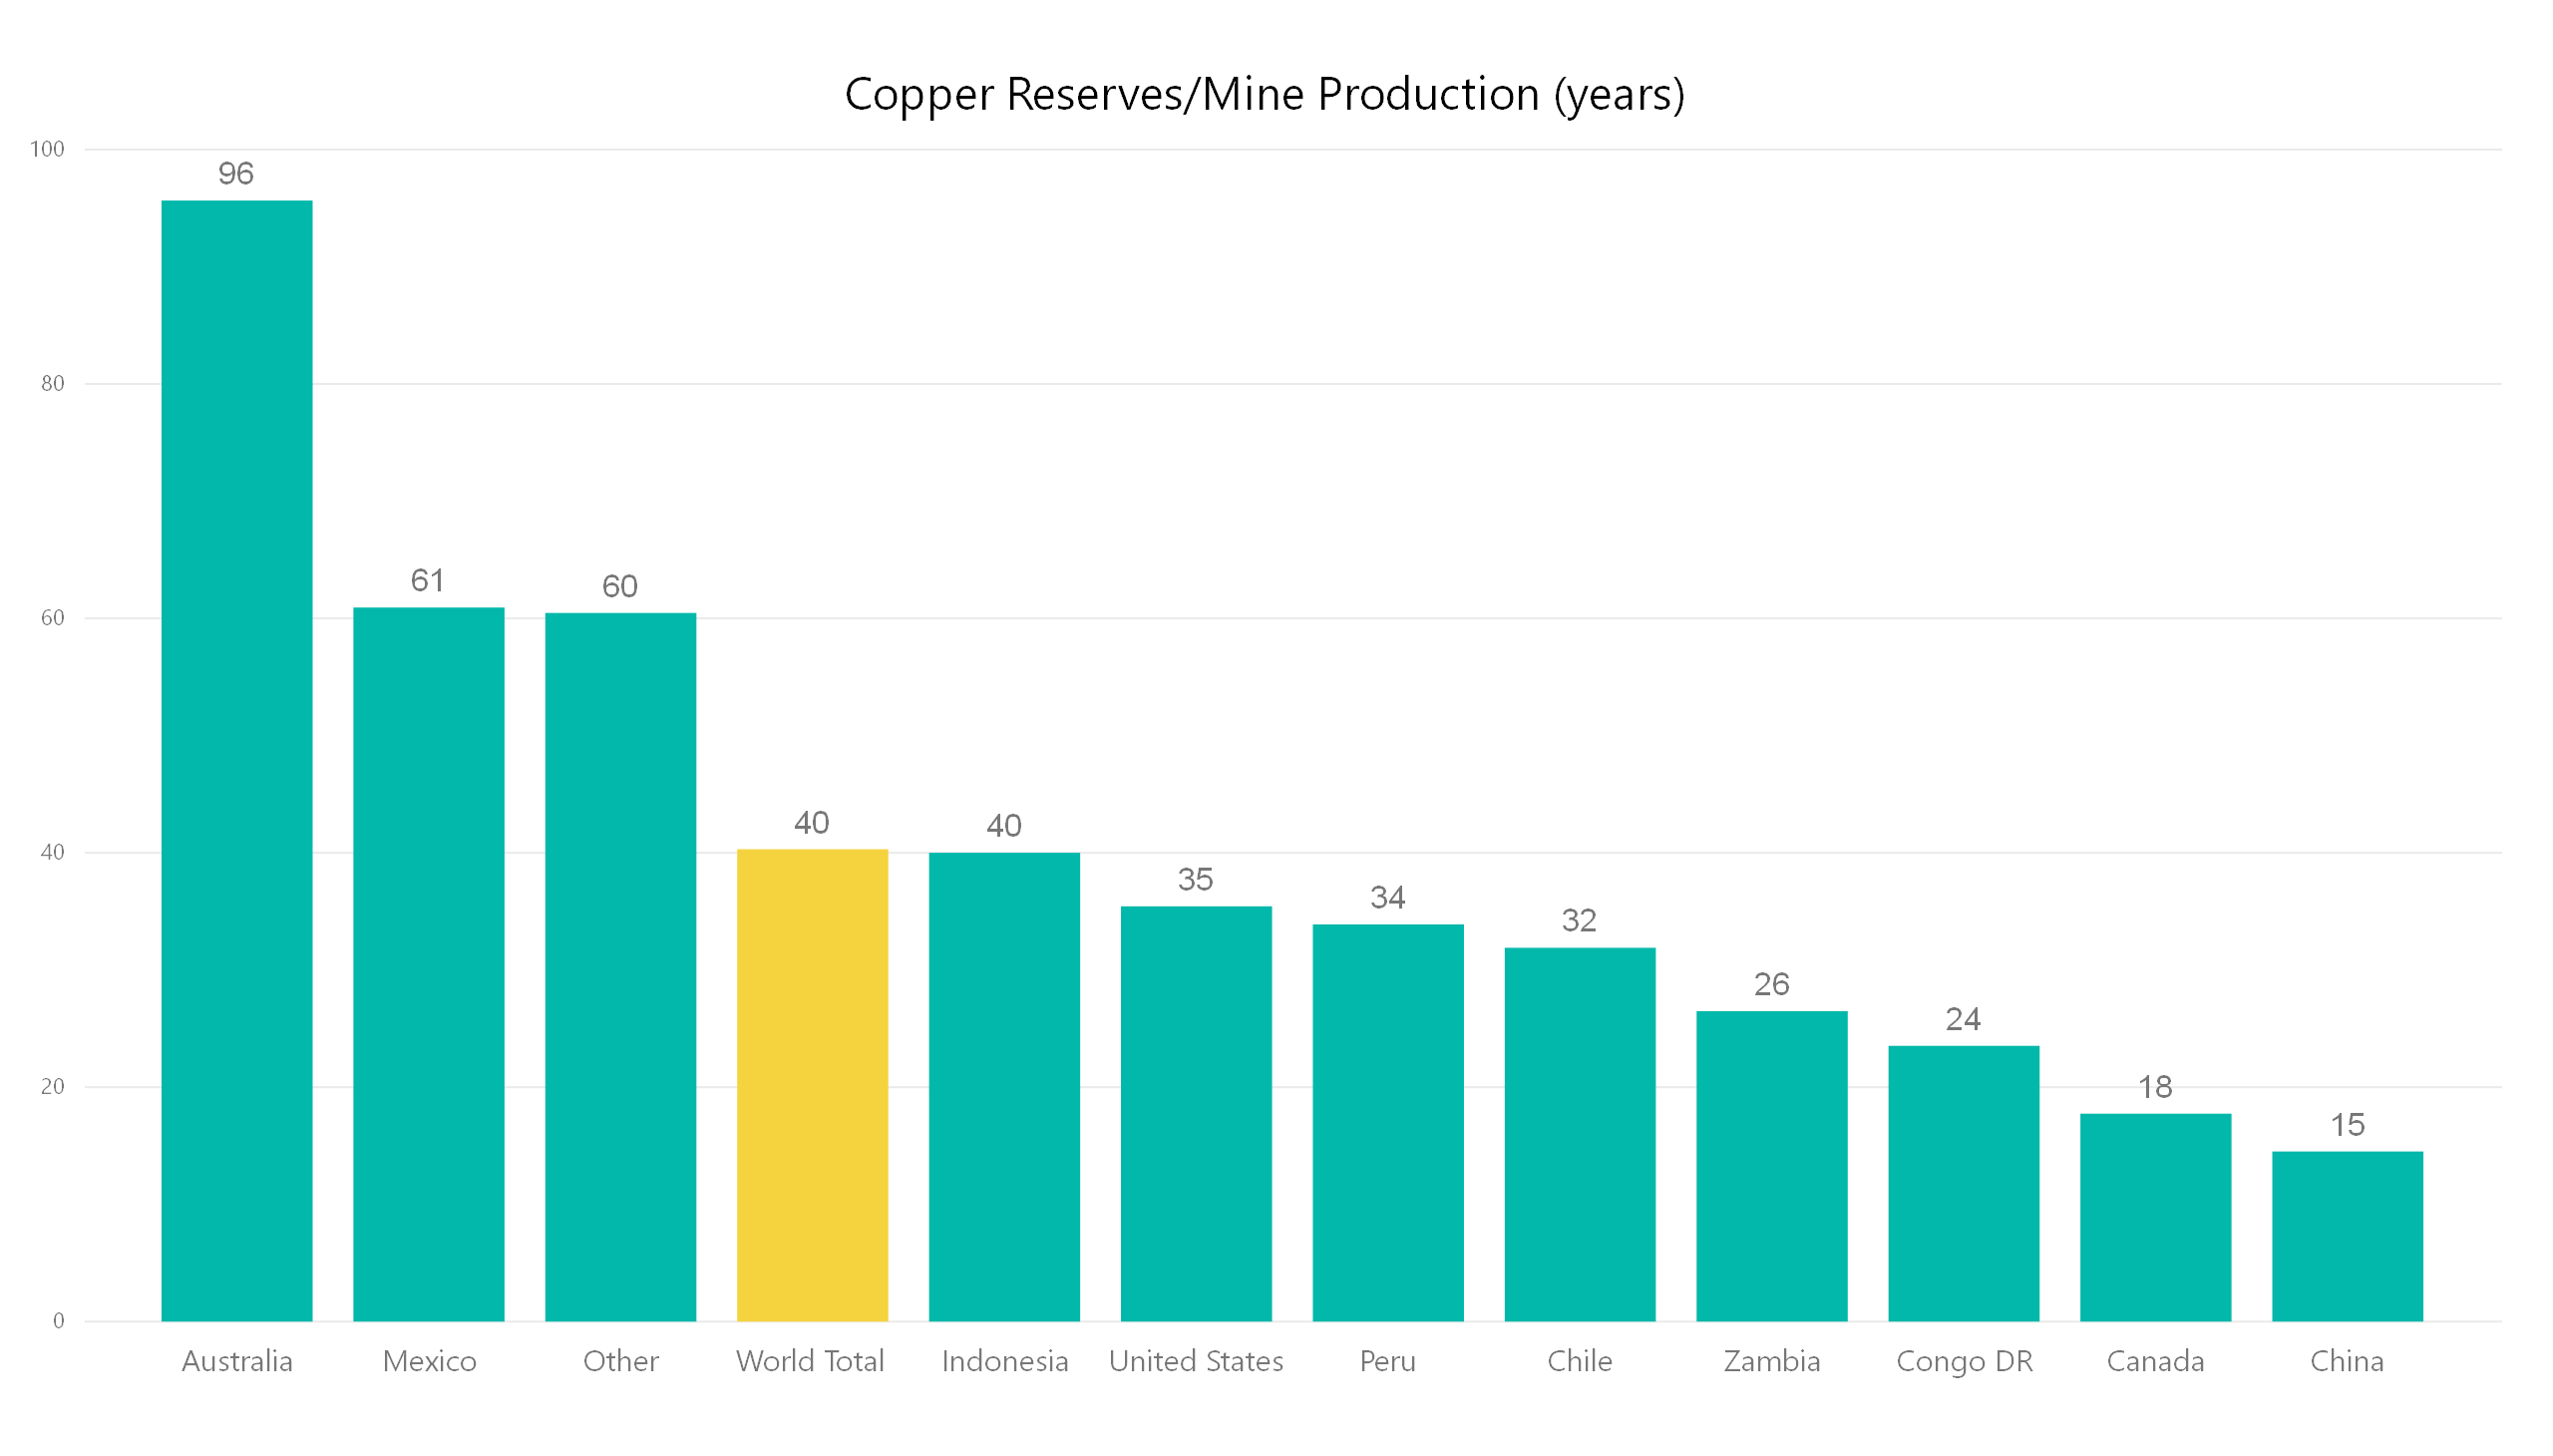
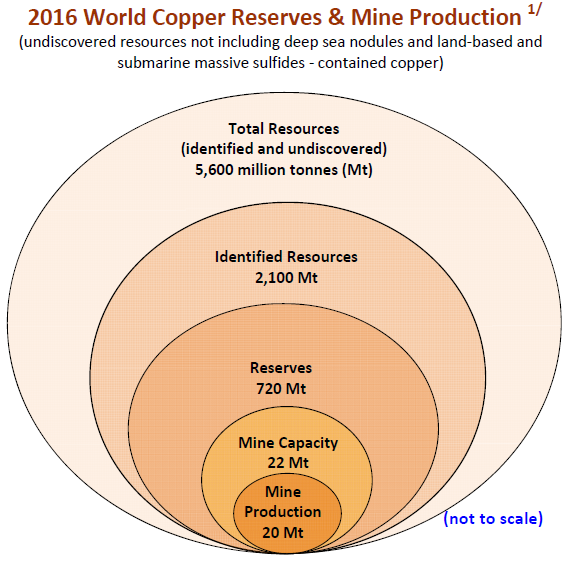
While global demand for copper has continued to expand, so has global reserves, fueled by developments in exploration techniques and other advances that have improved the economic valuations of mines around the world. The current global reserve-to-production ratio is around 40 which means that if mining continues at the same rate, there will be 40 years left of production (International Copper Study Group, 2017). Considering that reserves only consider economically viable ore bodies in the ground, and that the global copper-known resources are significantly larger than reserves, it is highly improbable that there will be a copper shortage.
Figure 6- United States Geological Survey, 2018
Refined copper market overview
Figure 7- European Copper Institute
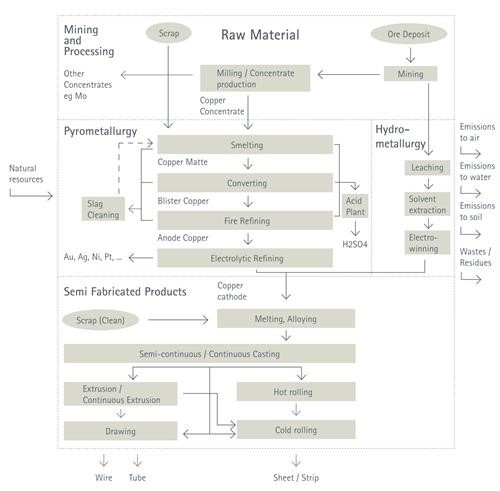
Once copper is mined, it is then processed and refined to produce pure copper cathode. In addition to copper concentrates that come from smelters, scrap copper or recycled copper can be melted and re-purified (University of Arizona, 2018). Pure copper cathode is then converted to semifabricates such as wire, plates, sheets, and strips. These semifabricates are used to create end-use products common in our daily lives. Semifabricates can be held as stock until needed for the fabrication of end-use products, and it, along with scrap copper, can be recycled at the end of its life.
Figure 8- International Copper Study Group
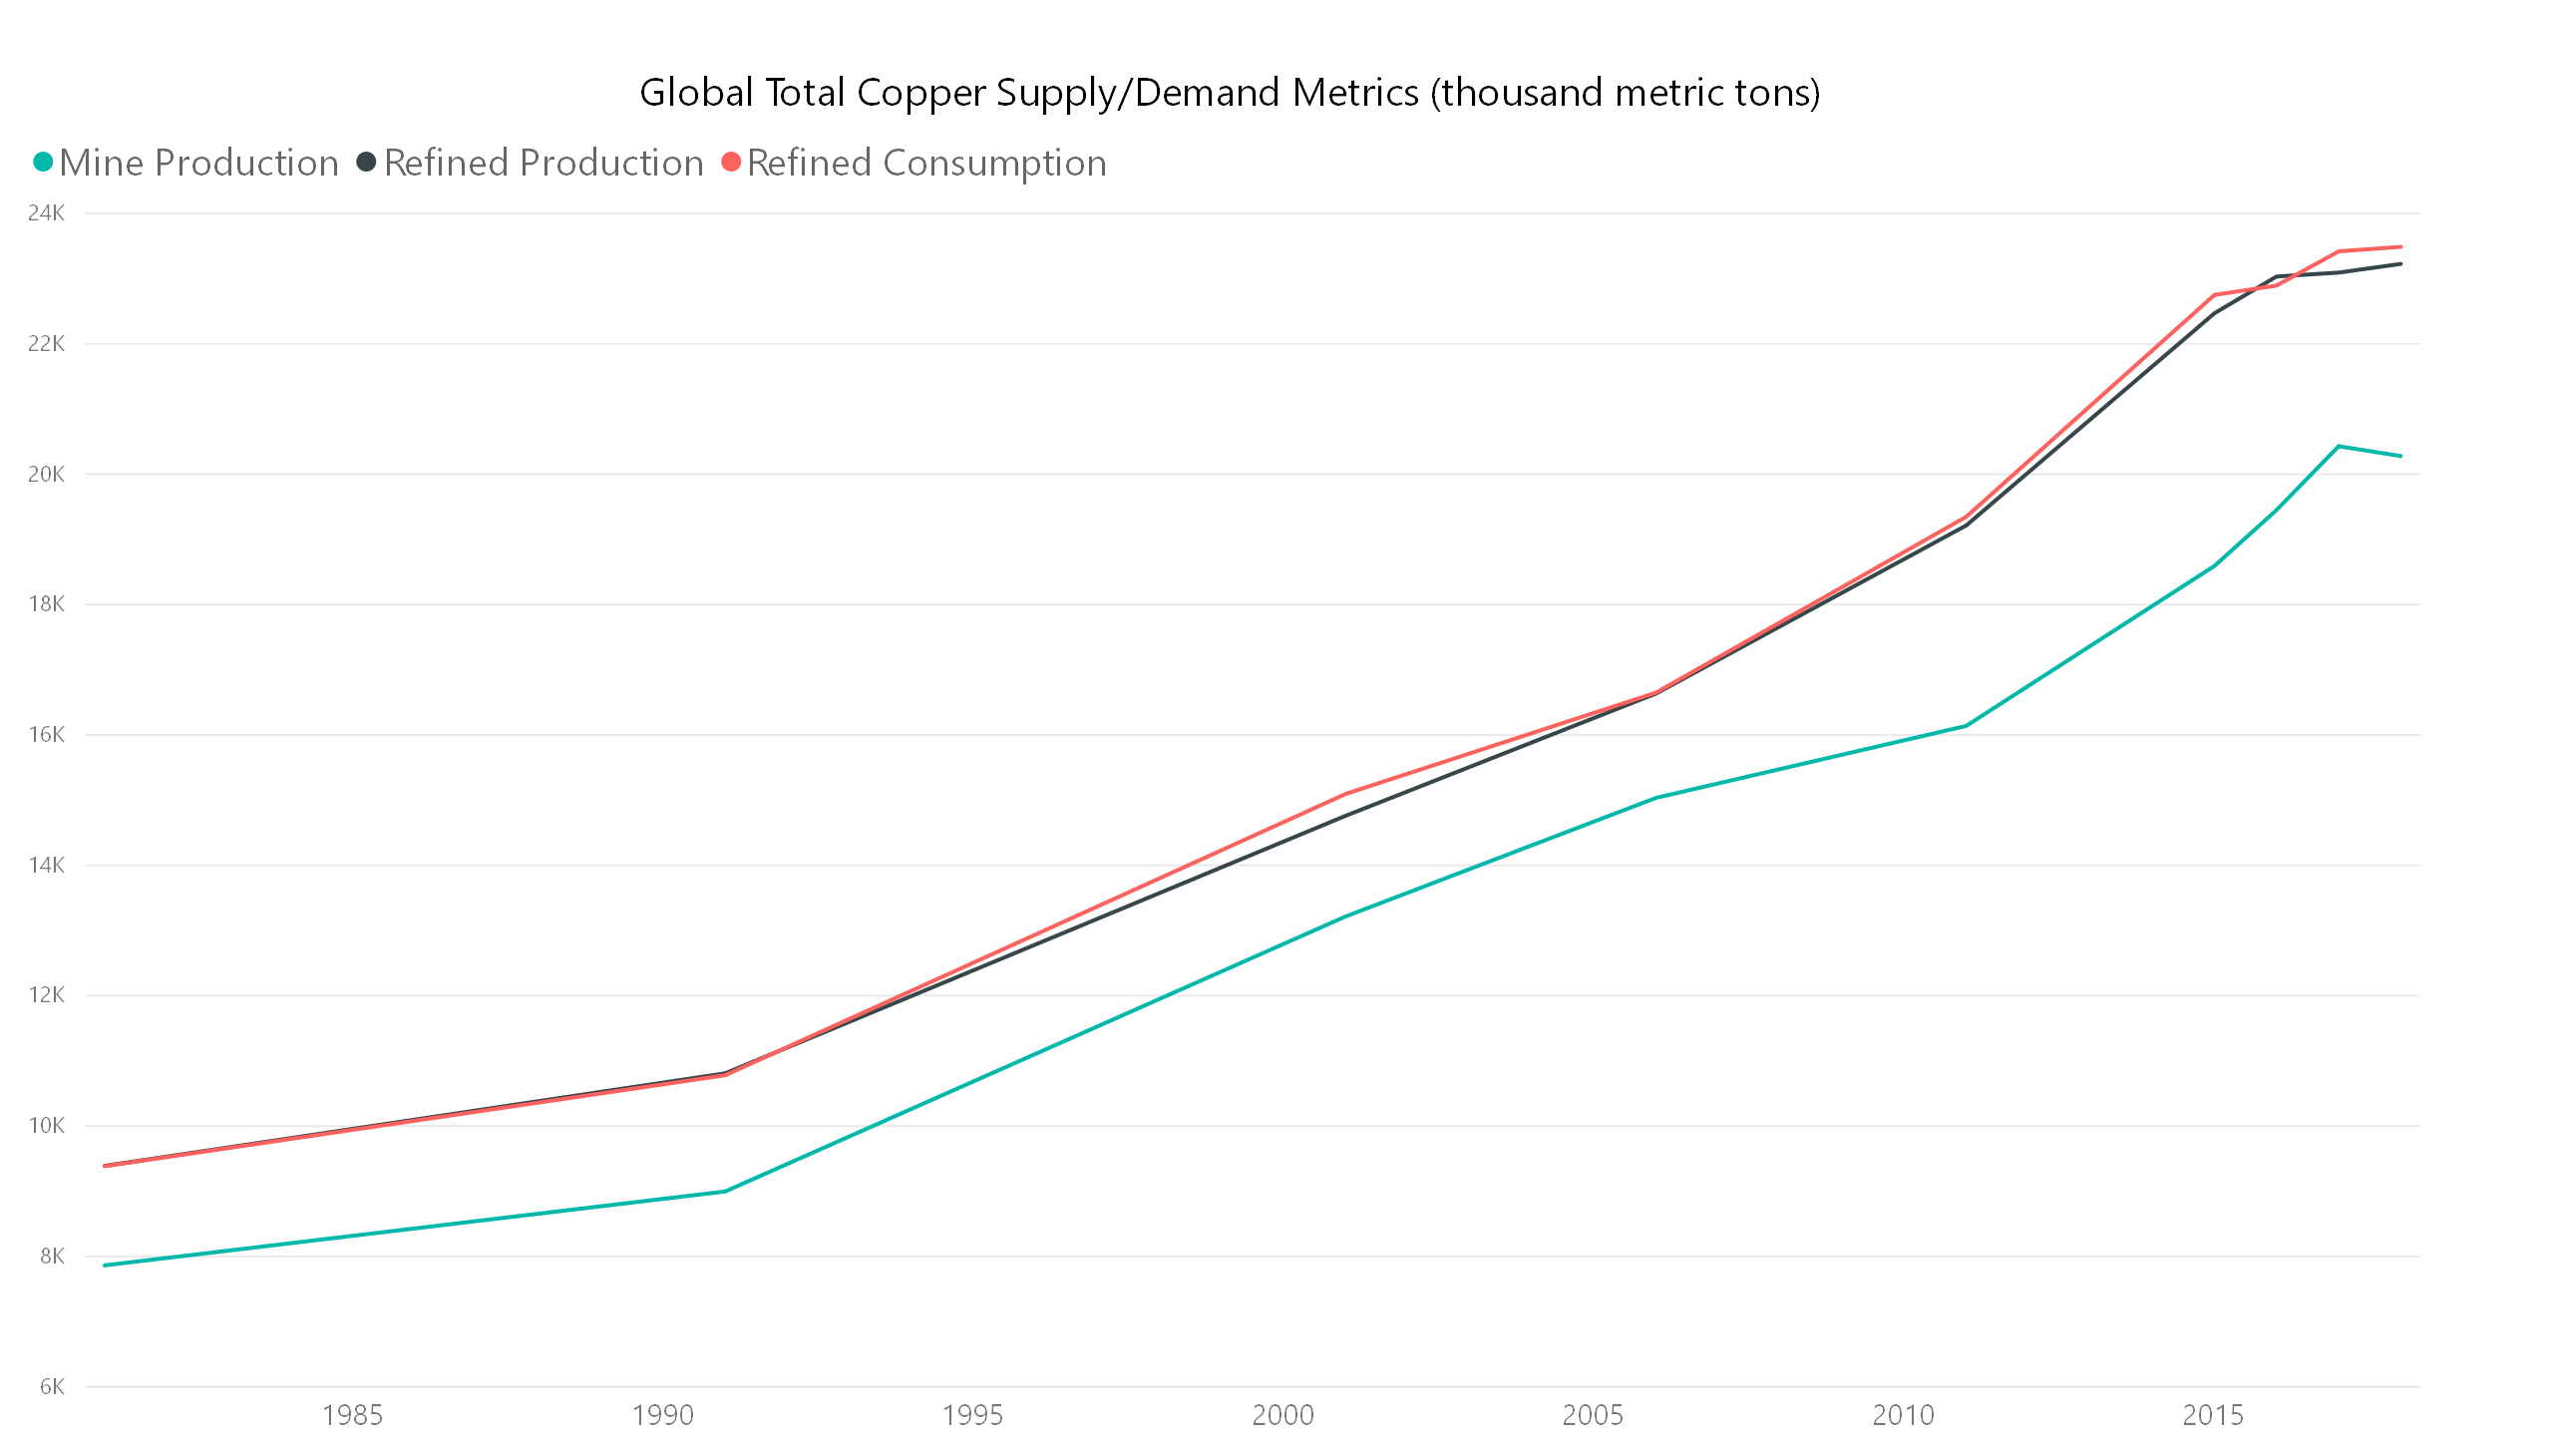
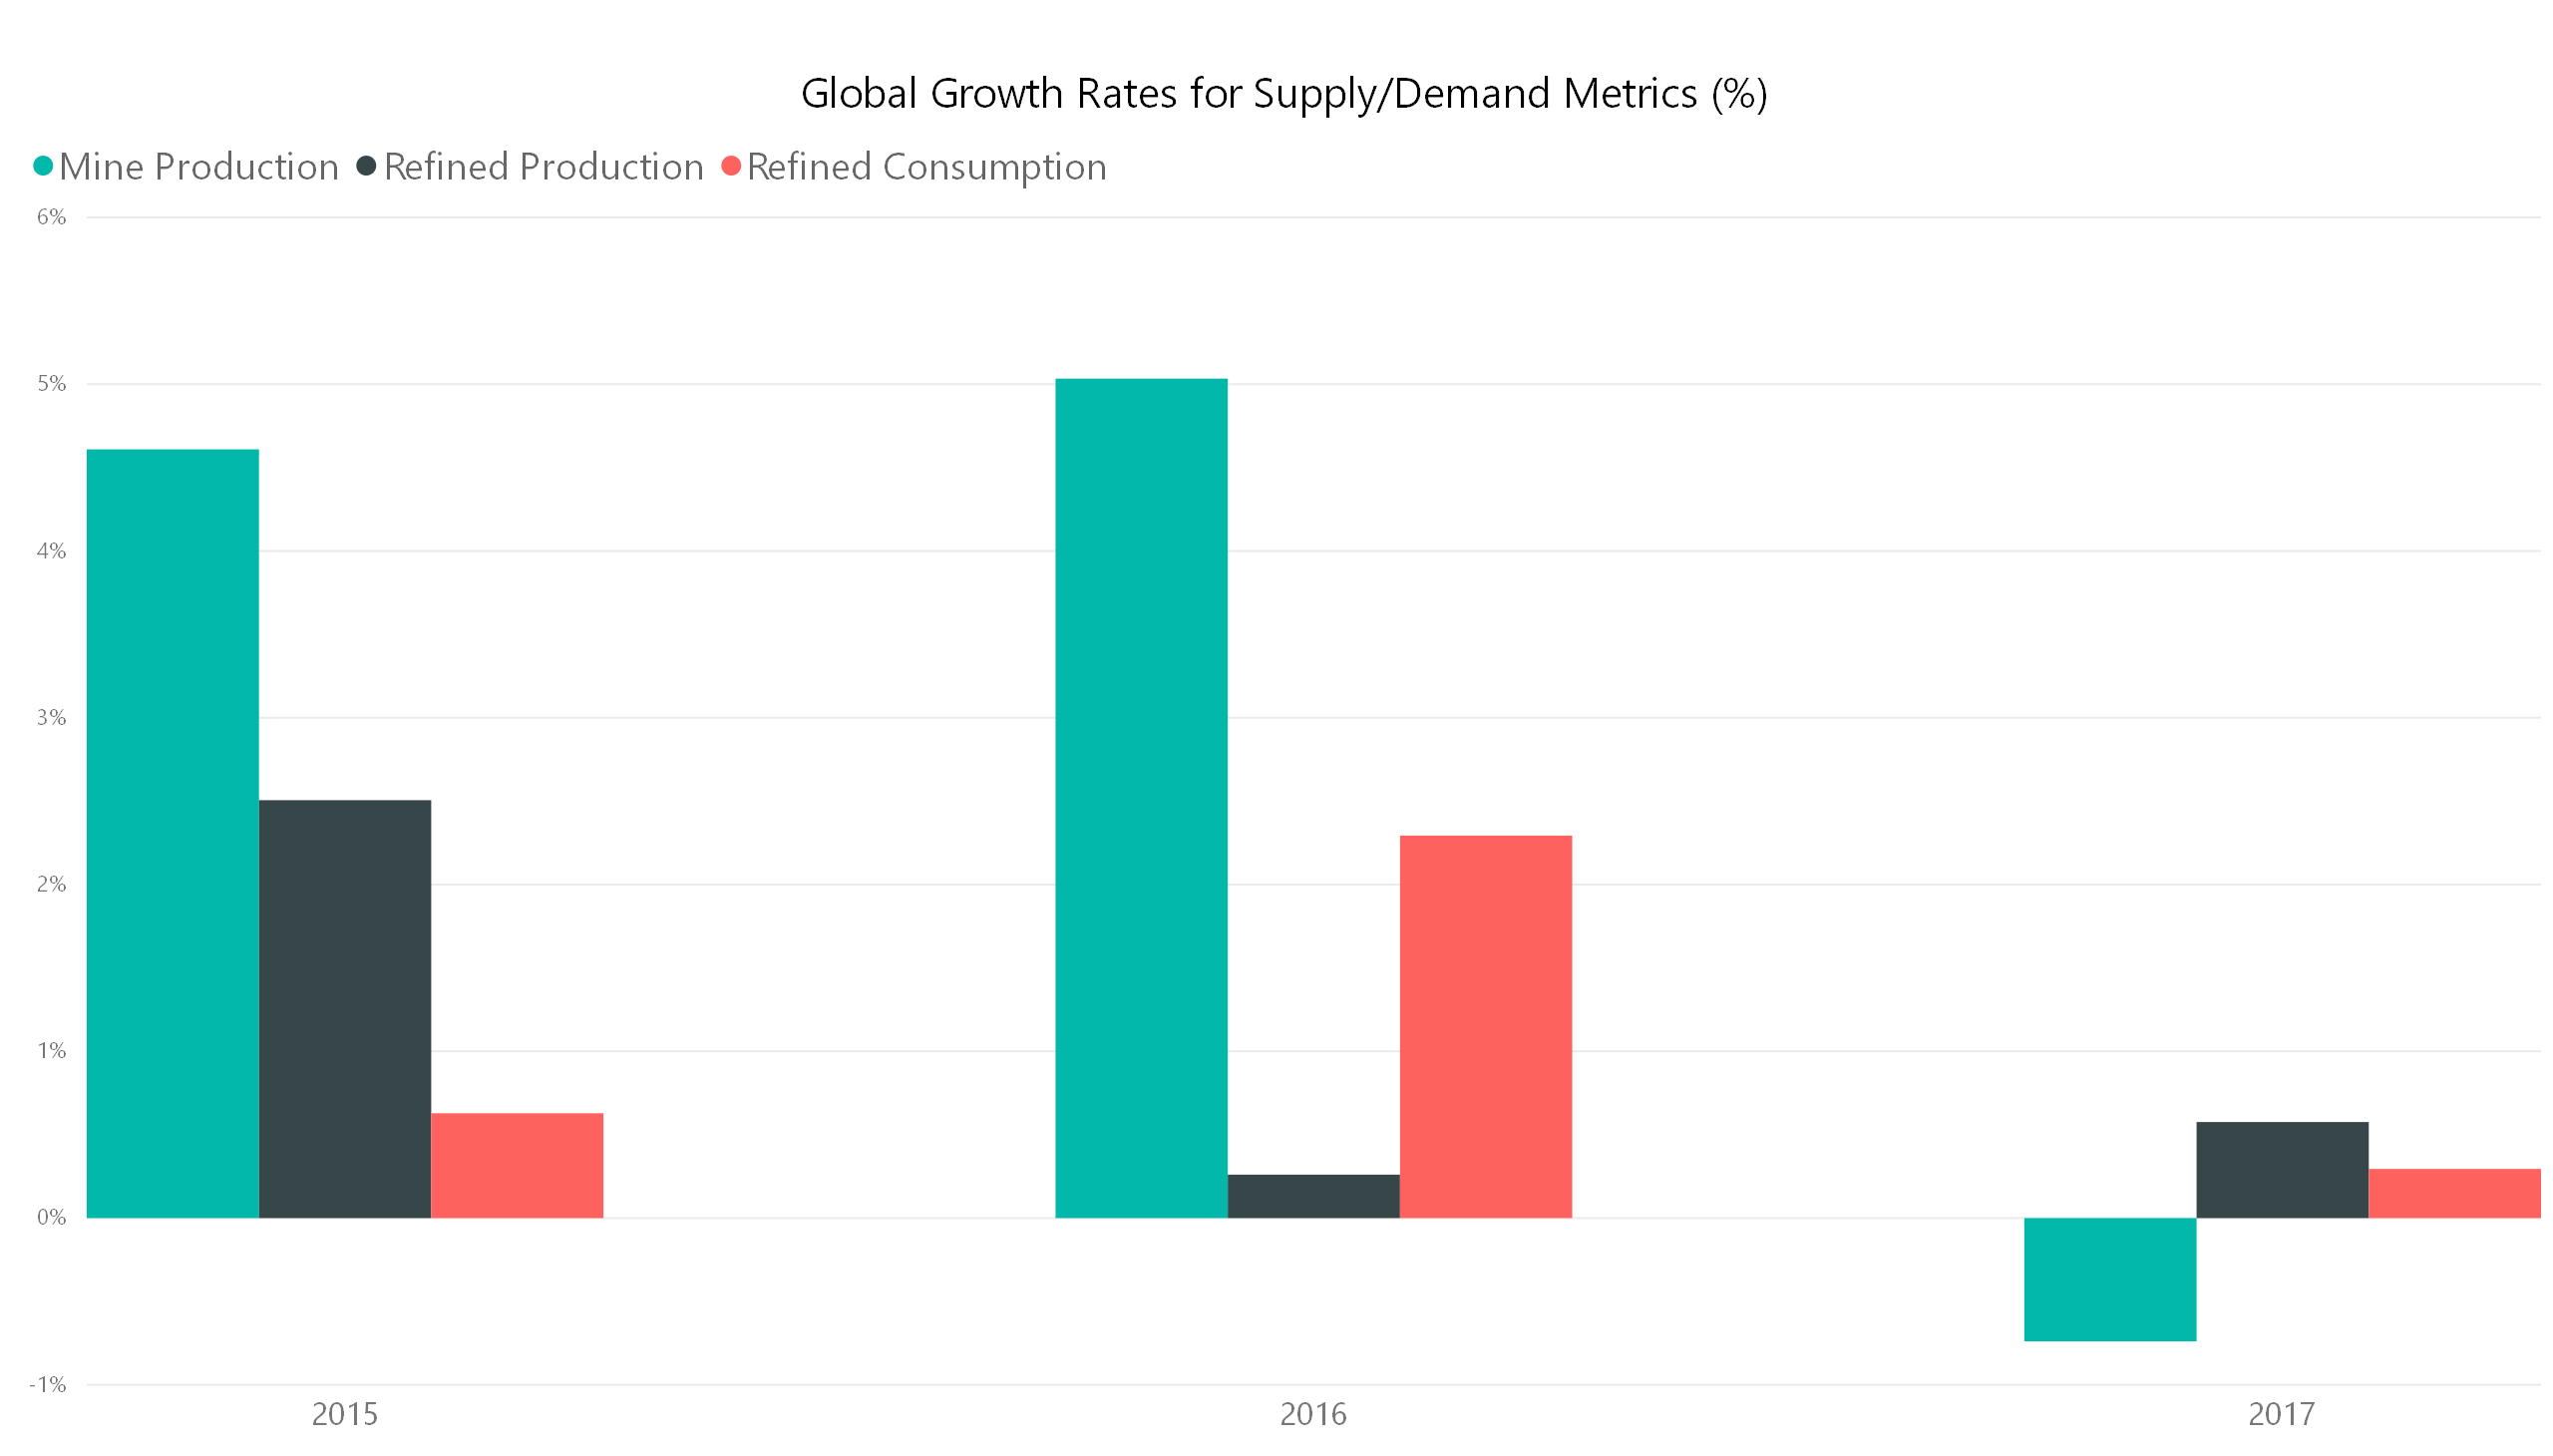
Refined production and consumption has historically been around 15 percent higher than mine production. The annual growth rates for refined consumption and production have been between .25 percent and 2.5 percent the last three years indicating the continued growth of copper use (International Copper Study Group, 2017). Mine production has greater fluctuations, which is to be expected, as global copper mines are long-life projects that can be slow to start up, and copper mine disruption can have significant impacts on global production.
Figure 9- International Copper Study Group
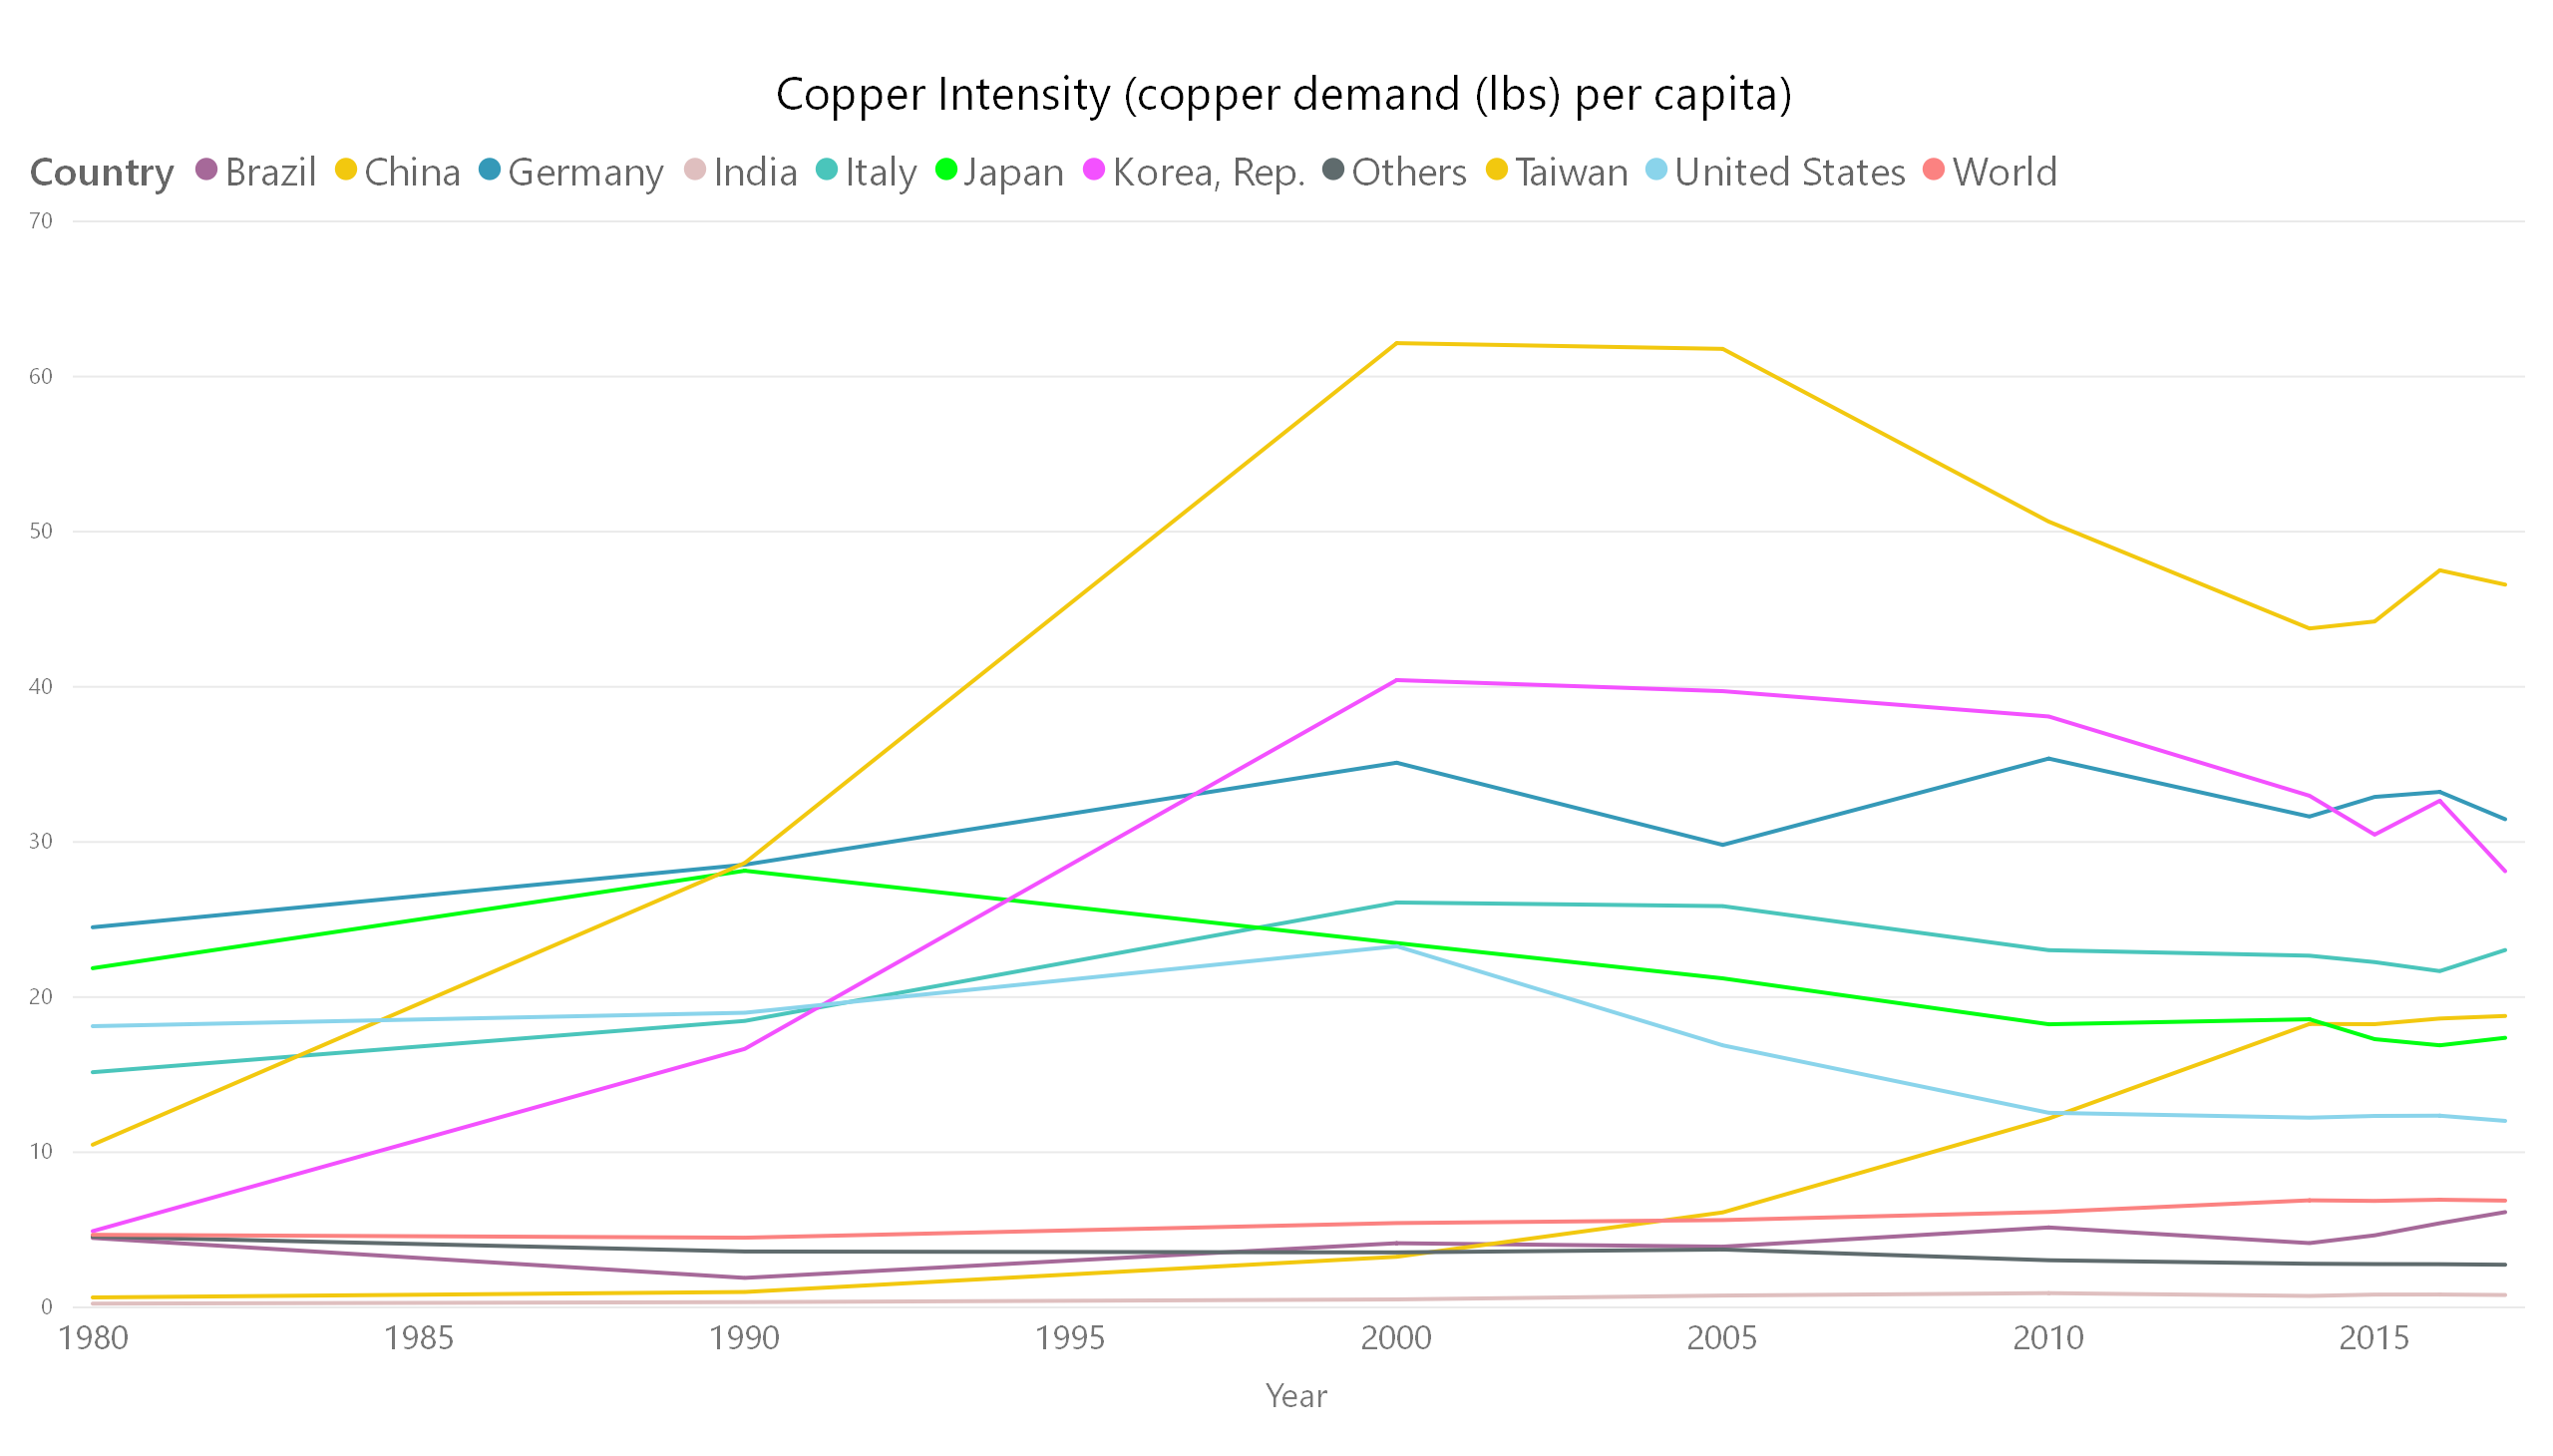
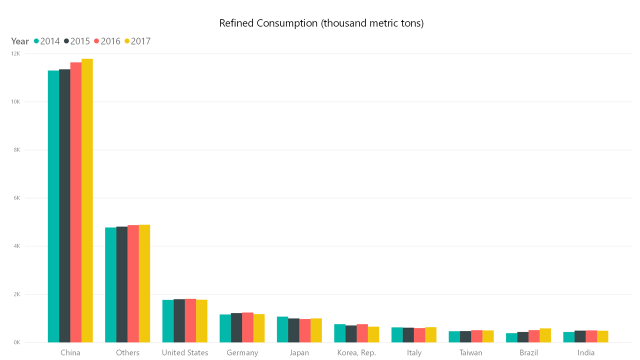
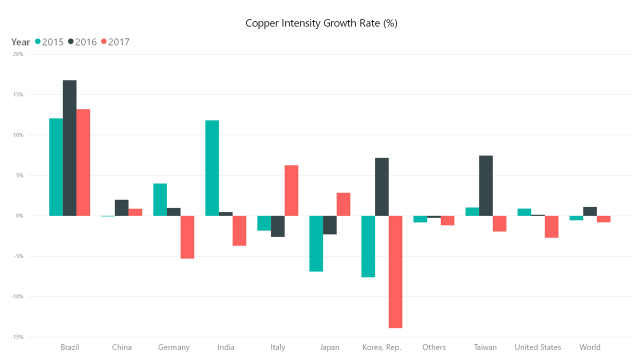
Copper intensity is defined as refined copper demand per capita and can be an indicator of a country’s level of infrastructure development. As countries invest in a fully electrified grid for the first time their copper intensity grows rapidly and then begins to plateau and finally decreases as the grid is built out. Some countries, America included, have not invested in their electrical system for decades and are in need of new infrastructure.
Figure 10- International Copper Study Group, Trading Economics
Macroeconomic trends for copper
Figure 11- Federal Reserve Economic Data, Trading Economics
The price chart for copper has a high degree of variability and is primarily a result of the lag that exists in the cyclical nature of copper mining (Federal Reserve Economic Data, 2018). Copper price is driven by miners having margins that can support capital expenditures for development. World-class copper mine development can take years, as is the case of Turquoise Hill’s Oyu Tolgoi deposit in Mongolia which is projected to begin underground production in 2021 after re-starting the project in 2016 (Turquoise Hill Resources, 2016). Although timely, these investments can create significant value by re-characterizing resources as reserves and ramping up production. Once a mine has established production it is capable of investing in further developments as the commodity price shifts, or costs fall.
Figure 12- International Copper Study Group, United States Geological Survey
Around the turn of the 21st century, the growth of emerging economies such as China spurred investment in known copper resources, due to an increased copper demand per capita.
Figure 13- International Copper Study Group
The investment in progressing copper resources to production caused a glut of supply in the market. Following the all-time high in 2011 this supply glut caused a five-year price decline that bottomed in 2016. Since that time the copper price has slowly been inching up as new mines have begun production and other mines have slowed production to avoid losses.
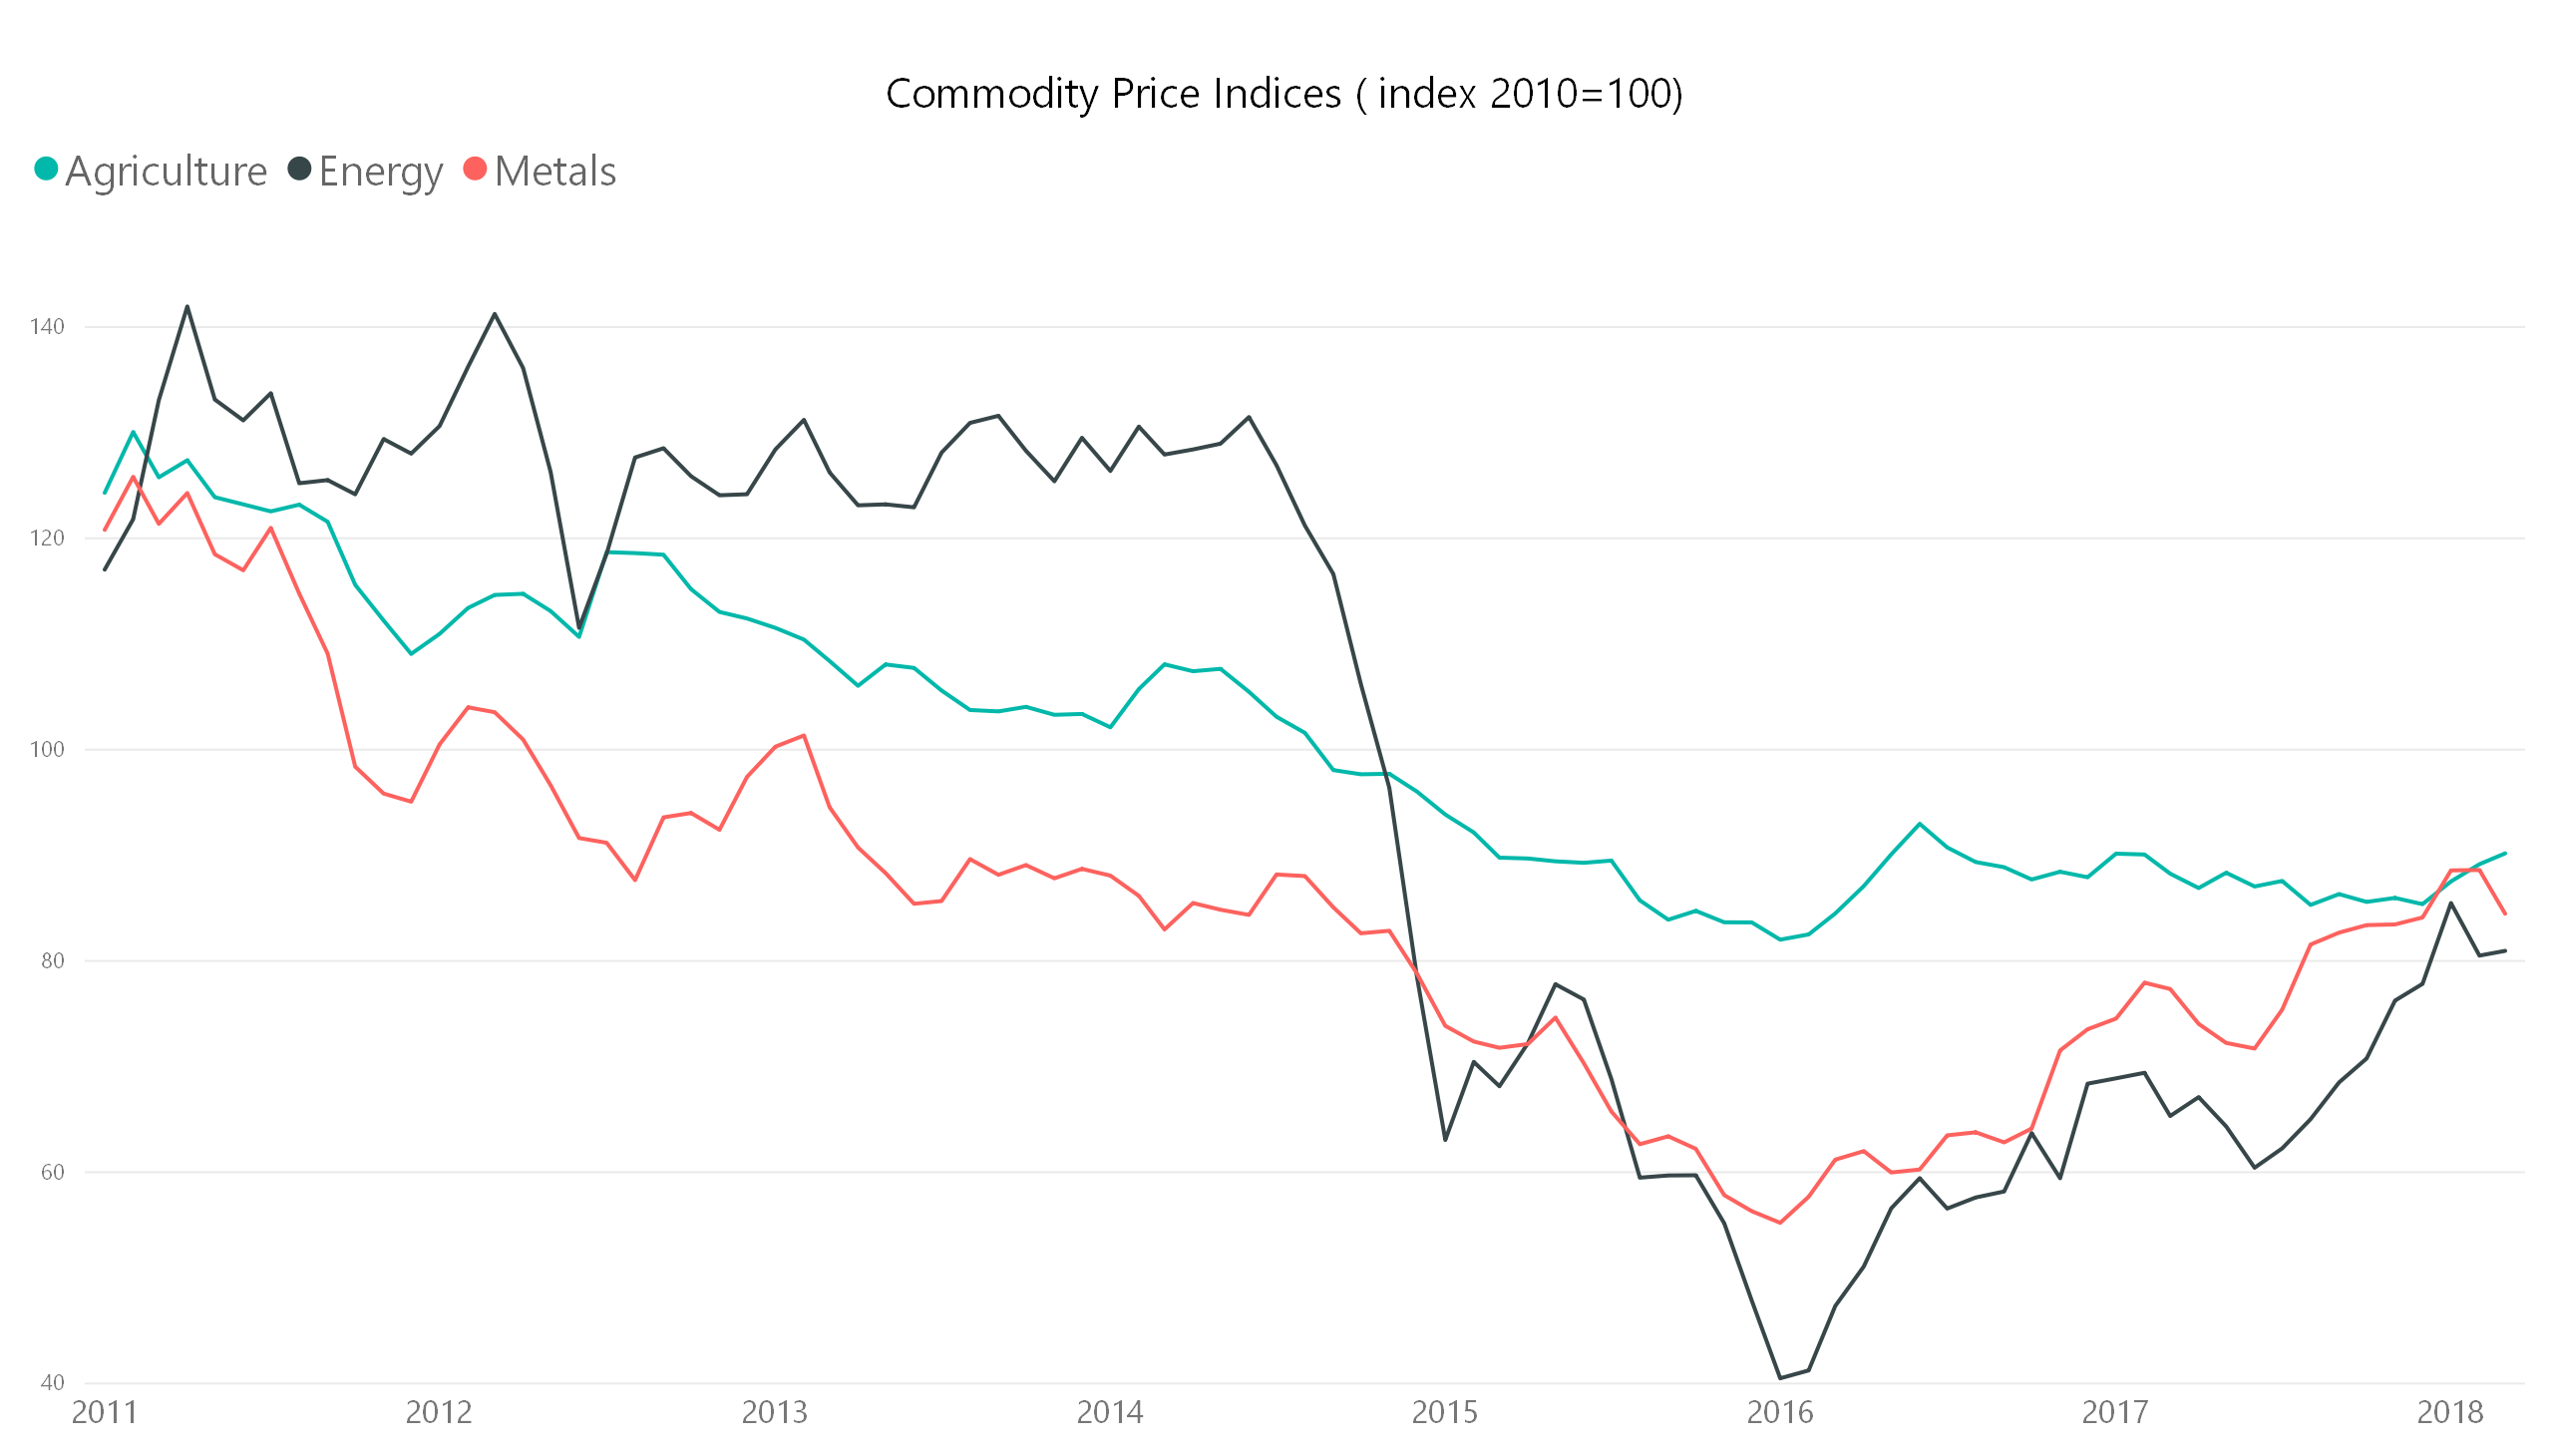
Many commodities were booming around 2010 (World Bank, 2018), mainly thanks to China’s industrialization and speculation that they would continue to demand massive amounts of resources for years to come. As a result, upstream resource companies invested heavily in developing their base to add reserves.
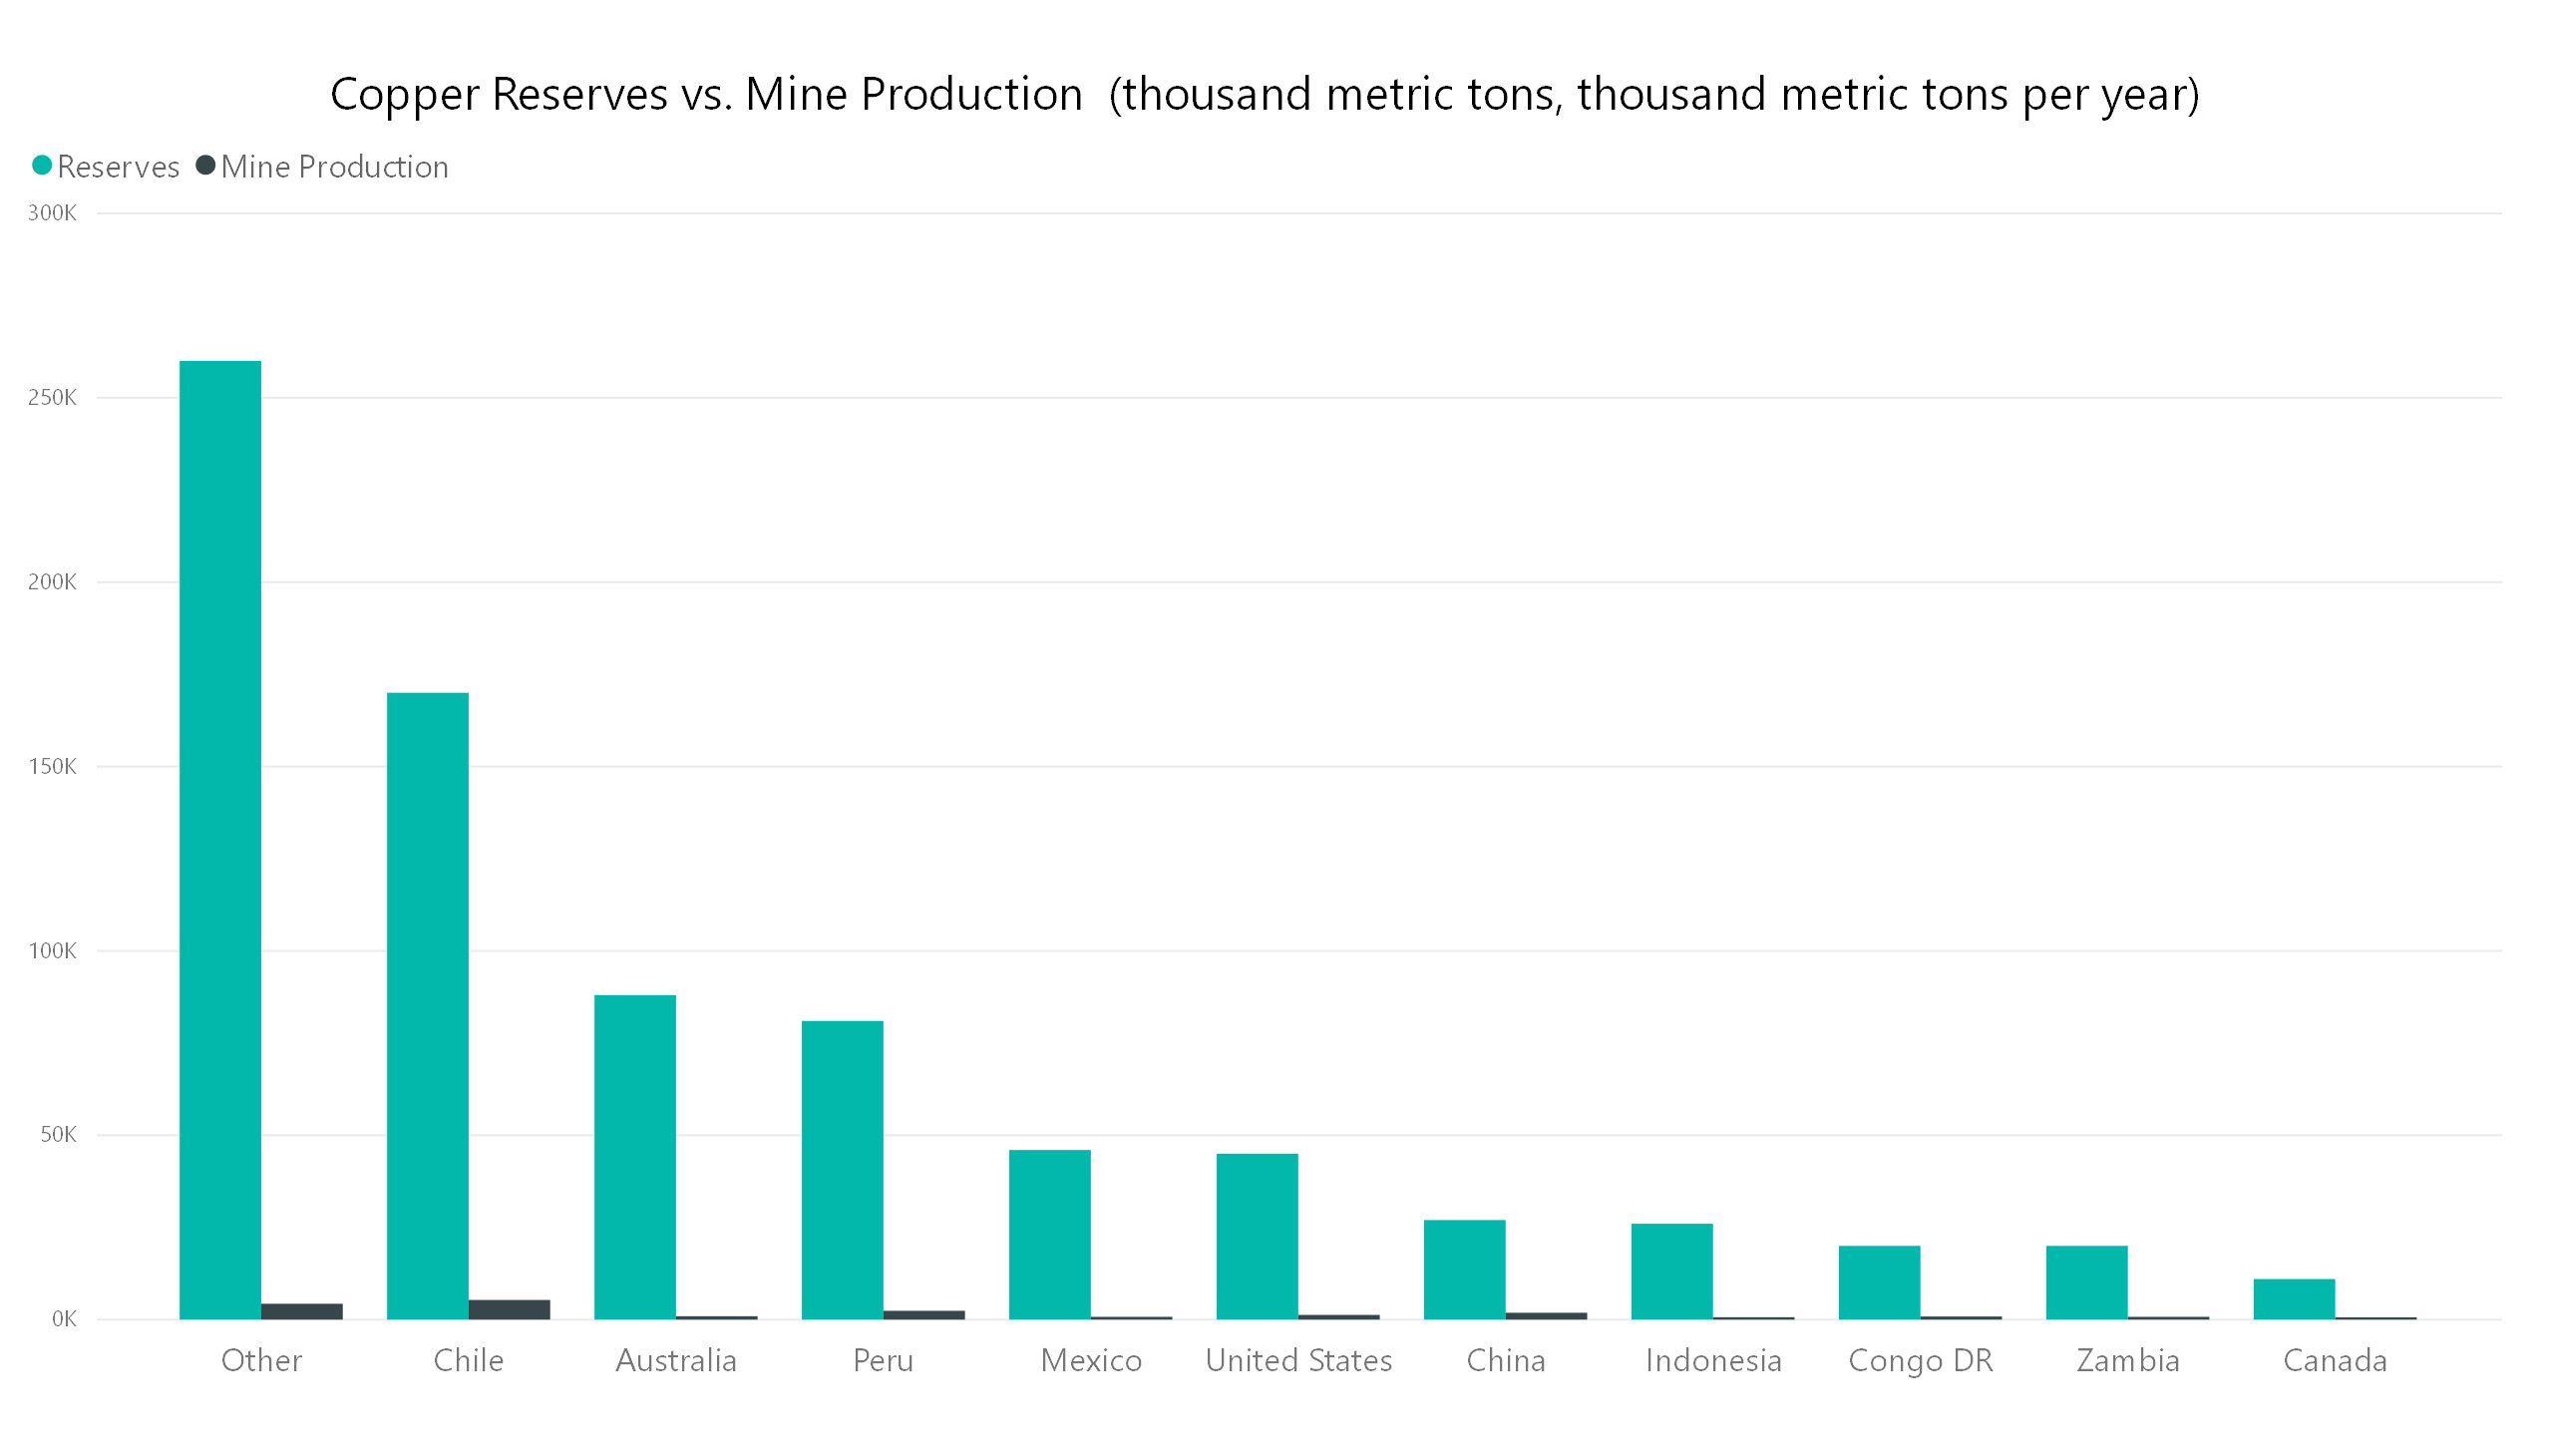 Figure 14- United States Geological Survey, 2018
This investment got ahead of itself and caused consistent price declines across the commodity space until it reached bottom around January 2016. Since then, commodities, including copper, have been on an upward trajectory. Even so, copper has hovered below its recent and historic highs.
Disruptive trends for copper
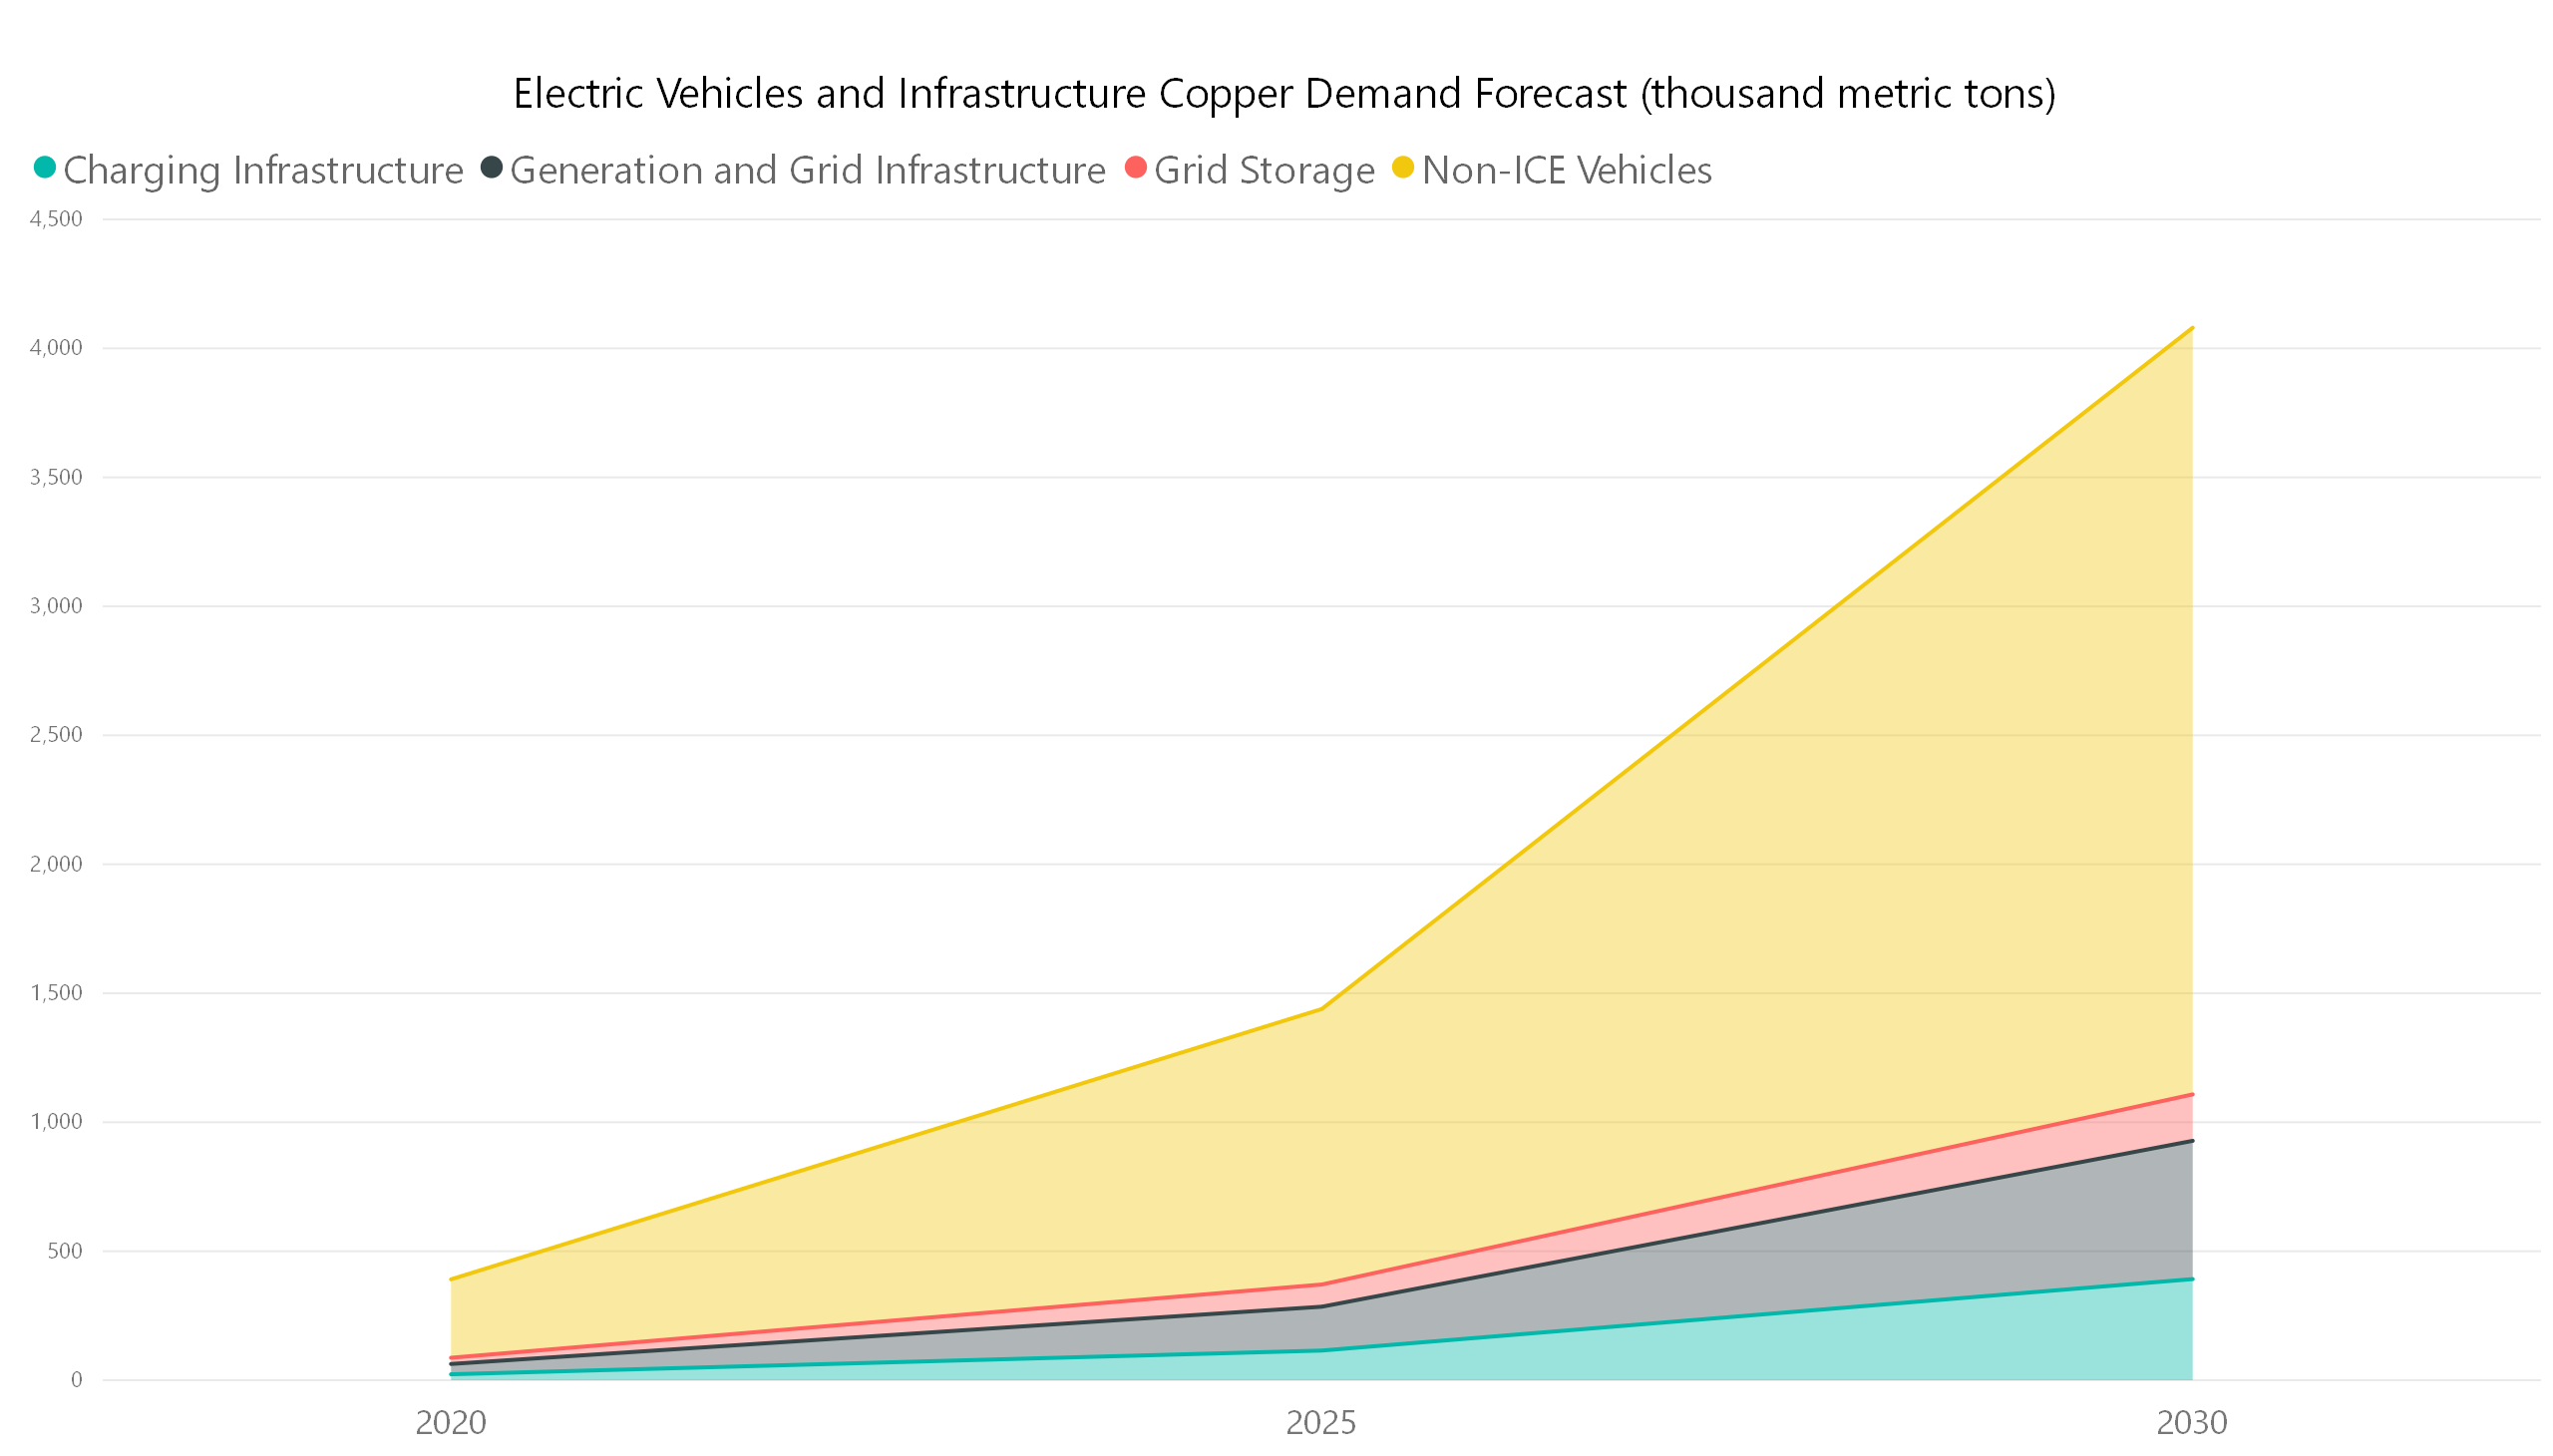
With new and current technologies and population growth, copper will continue to be in demand around the globe. There are potential disruptions that could fuel even greater demand, including the advent of new technologies at a commercial scale (Glencore, 2018). Non-internal combustion engine vehicles, or non-ICE vehicles, and the infrastructure needed to charge vehicles are forecasted to have a large impact on future demand for copper.
Figure 15- International Energy Agency, Glencore
According to the “Electrical Vehicles Initiative” put out by the International Energy Agency, countries should strive to reach 30 million electric vehicles by 2030 (IEA, 2018). This initiative is ambitious, but is being pursued by some of the largest governments around the world including China and India. With pollution reaching dangerous levels in places like China, officials are desperate to reduce the issue through the use of electric vehicles. Though time will tell whether targets will be reached for electric vehicle penetration by 2030, it’s not a stretch to realize that electric vehicles will become more prevalent around the world. Research has been performed to forecast how much copper and other critical minerals will be needed to reach the IEA’s target by 2030, and offers insights into its significance regarding future copper demand.
Figure 16- International Energy Agency, Glencore
Projections show that if the goal of 30 million electric vehicles sales by 2030 is achieved, there will have been nearly 4000 thousand metric tons of copper per year added to the demand (Glencore, 2018). That portion today represents 17 percent of current consumption. In the near term, the U.S. and other countries need to reinvest in an electrical transmission infrastructure. Other countries, such as Brazil are making initial electrical transmission investments. Both trends seem likely, but investors should make sure that commodity prices don’t get ahead of themselves again.
Figure 17- International Copper Study Group, Trading Economics
Investing in copper
When commodities declined following the 2010 boom, it offered an opportunity to allocate to the space at attractive valuations.
Figure 18- World Bank
Versant Capital Management’s preferred vehicle for investing in the space is to buy a portfolio of equities that have exposure to different commodities across agriculture, energy, and minerals. This diversification offers protection against single security risk and ensures that the companies held in each commodity are the largest producers and investors in the space.
A company included in this portfolio is Phoenix-based Freeport McMoran (NYSE:FCX). FCX is the second largest Phoenix-based company by sales and the largest by net income at $16.4 billion and $1.82 billion, respectively (Brown, 2018). FCX’s sales are driven by copper, and have interests in and operate some of the most significant copper deposits around the world, including the Copper Mountain of Morenci in Arizona.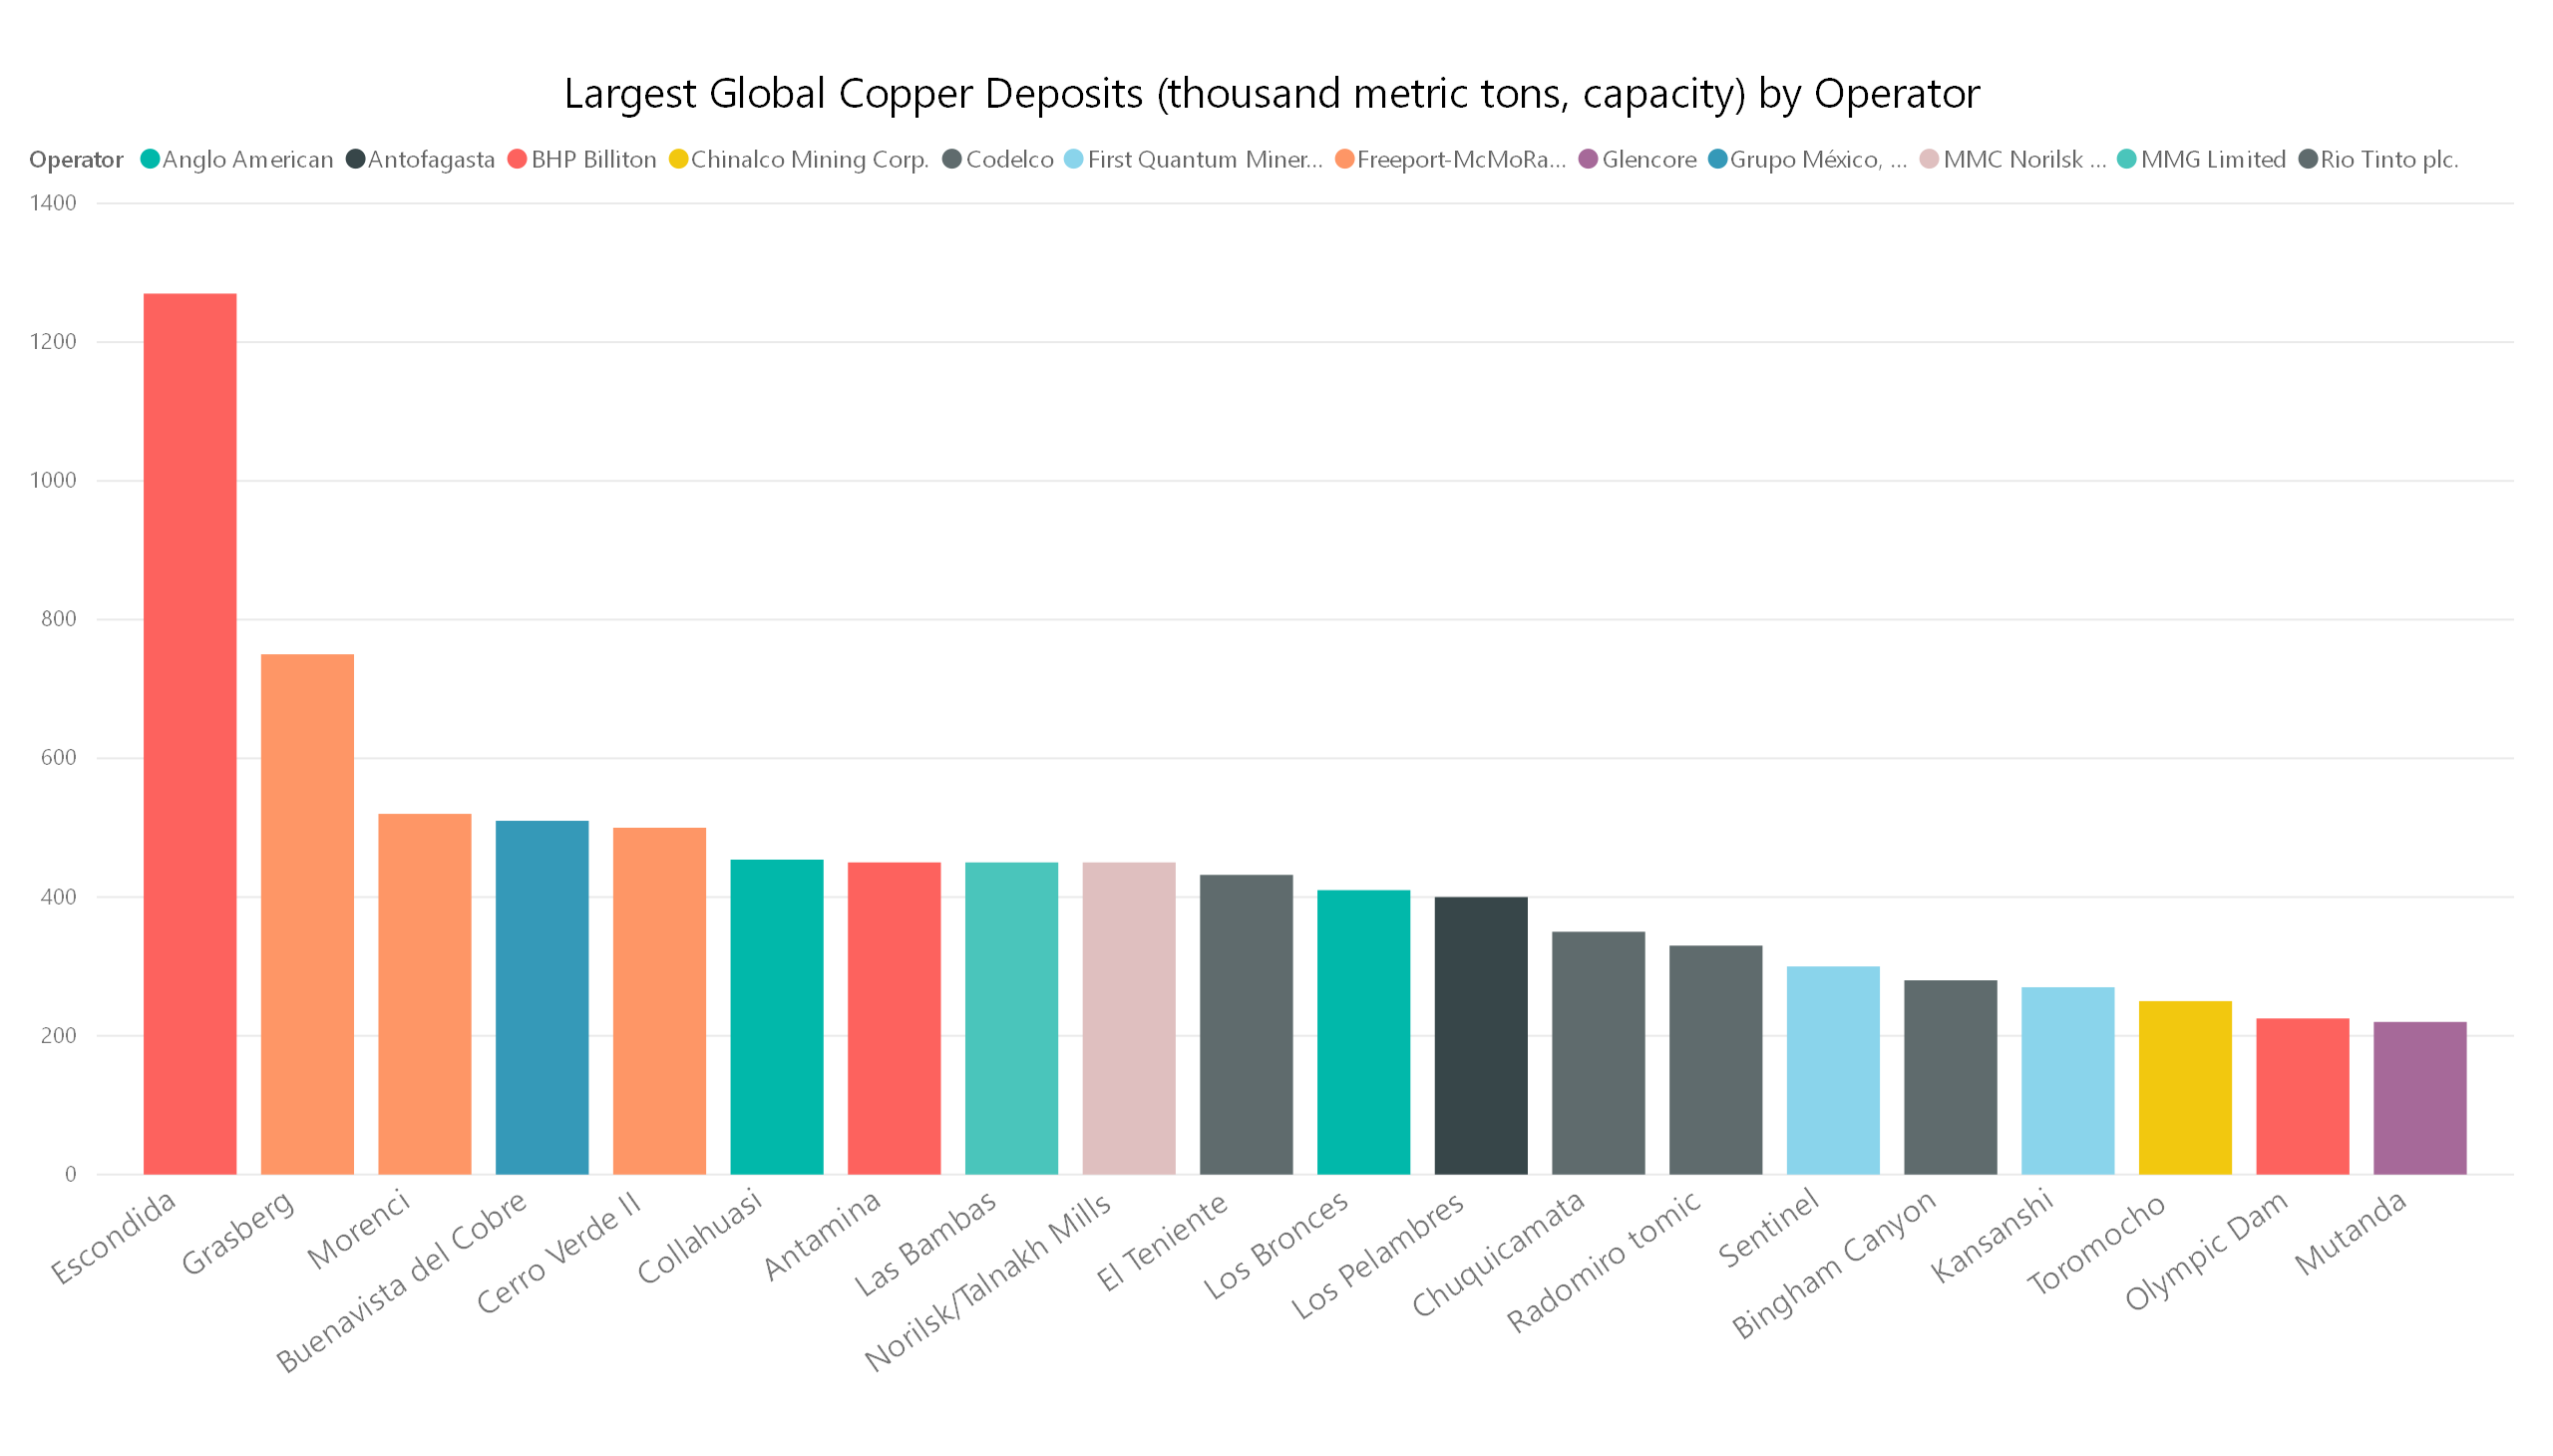 Figure 19- International Copper Study Group
It is one of the most cost-effective ways to invest in copper and has upside potential for those willing to take on the single security risk. The largest copper producers around the world don’t seem to be selling their top assets either, which is usually a good indicator that the management teams feel strongly about their potential to generate future profits for their firm from these assets (Bloomberg News, 2018).
Conclusions
The moniker Doctor Copper is analogous to copper’s price index and as an indicator of global growth. Versant Capital Management’s analysis supports this concept, and our firm believes that the fundamentals have copper positioned well for the future.
It will be interesting to follow the annual growth trends of specific countries to see what ones may be developing their electrical infrastructure in a manner that can expand technology benefits to drive economic productivity across their entire populations. The near- and longer-term disruptions of developed countries reinvesting in their electrical systems, and electrical vehicles sales penetration are potential drivers of future demand, but we believe the outlook is strong even without those aggressive scenarios. We will keep a close eye on copper to make sure it does not get ahead of itself, with a concern that investors using copper as a trade for electrical vehicle penetration, solely, may distort market values in the near term.
Hopefully, Doctor Copper doesn’t teach us another lesson about speculation and investors will remain disciplined and focused on the fair value of these investments. As for Arizona, it appears the position of Copper King is as firm as ever. With our beautiful state opening its doors to mining businesses and offering infrastructure to match our world-class deposits, it is easy to understand why Arizona is ranked 7th by mining executives regarding from where they would prefer to operate (McLeod, 2017)..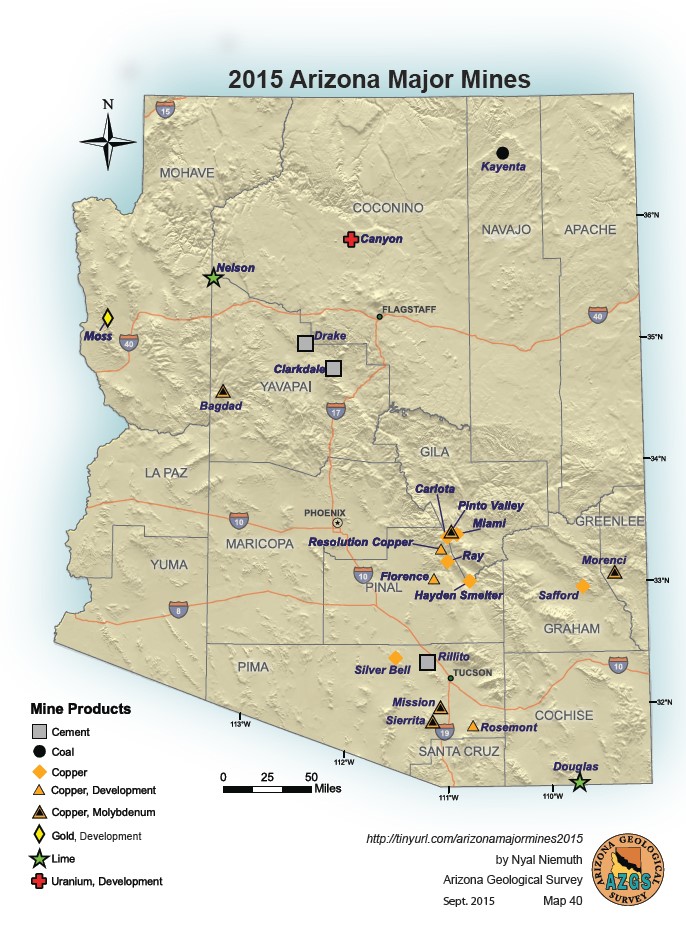
Figure 20- Arizona Geological Survey
References
Arizona Geological Survey. (2018). King Copper. Tucson, AZ, USA.
Bloomberg News. (2018). World’s biggest miners want more copper but nobody’s selling. Retrieved from Mining.com: http://www.mining.com/web/worlds-biggest-miners-want-copper-nobodys-selling/
Brown, D. (2018). Largest Arizona-based Public Companies. Retrieved from Phoenix Business Journal: https://www.bizjournals.com/phoenix/subscriber-only/2018/06/22/largest-arizona-based-public-companies.html
Dartmouth Toxic Metals. (2018). Copper: An Ancient Metal. Retrieved from Dartmouth Superfund Research Program: https://www.dartmouth.edu/~toxmetal/toxic-metals/more-metals/copper-history.html
European Copper Insitute. (2018). Processes: copper mining and production. Retrieved from Copper Alliance: https://copperalliance.eu/about-copper/copper-and-its-alloys/processes/
Federal Reserve Economic Data. (2018). Global price of Copper. St. Louis: Federal Reserve Bank.
Glencore. (2018). The EV revolution and its impact on Raw Materials. Glencore.
Guettelet, H. d. (n.d.). Diffusion of Metallurgy.
IEA. (2018). Global EV Outlook. International Energy Agency.
International Copper Study Group. (2017). The World Copper Factbook . International Copper Study Group.
McLeod, C. (2017). These 2 Canadian Mining Provinces Are Now the World’s Top Mining Destinations. Retrieved from Investing News: https://investingnews.com/daily/resource-investing/worlds-top-mining-destinations/
Trading Economics. (2018, May 31). Retrieved from https://tradingeconomics.com/
Turquoise Hill Resources. (2016). The future of Oyu Toygoi is Underground. Retrieved from http://www.turquoisehill.com/i/pdf/ppt/TRQ_RBC_Conference_Presentation_9_June_2016.pdf
United States Geological Survey. (2015). Copper Mineral Yearbook. USGS.
United States Geological Survey. (2015). Global Mineral Resource Assessment. Retrieved from USGS: https://pubs.usgs.gov/sir/2010/5090/
United States Geological Survey. (2018). Copper Mineral Commodity Summary. USGS.
University of Arizona. (2018). Copper Mining and Processing: Life Cycle of a Mine. Tucson, AZ, USA.
World Bank. (2018). Commodity Markets Outlook. World Bank.
Tyler Scott
Research Analyst
Tyler creates technology tools that provide insight and clarity to Versant Capital Management’s investment and wealth management processes and systems.
[mk_fancy_text color=”#444444″ highlight_color=”#ffffff” highlight_opacity=”0.0″ size=”14″ line_height=”21″ font_weight=”inhert” margin_top=”0″ margin_bottom=”14″ font_family=”none” align=”left”]Disclosure: Please remember that past performance may not be indicative of future results. Different types of investments involve varying degrees of risk, and there can be no assurance that the future performance of any specific investment, investment strategy, or product (including the investments and/or investment strategies recommended or undertaken by Versant Capital Management, Inc.), or any non-investment related content, made reference to directly or indirectly in this article will be profitable, equal any corresponding indicated historical performance level(s), be suitable for your portfolio or individual situation, or prove successful. Due to various factors, including changing market conditions and/or applicable laws, the content may no longer be reflective of current opinions or positions. Moreover, you should not assume that any discussion or information contained in this article serves as the receipt of, or as a substitute for, personalized investment advice from Versant Capital Management, Inc. To the extent that a reader has any questions regarding the applicability of any specific issue discussed above to his/her individual situation, he/she is encouraged to consult with the professional advisor of his/her choosing. Versant Capital Management, Inc. is neither a law firm nor a certified public accounting firm and no portion of the article content should be construed as legal or accounting advice. If you are a Versant Capital Management, Inc. client, please remember to contact Versant Capital Management, Inc., in writing, if there are any changes in your personal/financial situation or investment objectives for the purpose of reviewing/evaluating/revising our previous recommendations and/or services. A copy of the Versant Capital Management, Inc.’s current written disclosure statement discussing our advisory services and fees is available upon request.[/mk_fancy_text][/vc_column_text][/vc_column][/vc_row]


