Large and In Charge? Giant Firms atop Market Is Nothing New.
Tech standouts are drawing attention for their perceived sway on stocks, but leaders become laggards.
From Dimensional Fund Advisors with additions by Thomas Connelly, CFP, CFA.
A top-heavy stock market with the largest 10 stocks accounting for over 20% of market capitalization and a marquee technology firm perched at No. 1? This sounds like a description of the current US stock market, dominated by Apple and the other FAANG stocks,1 but it is actually a reference to 1967, in the period often referred to as the “Go-Go Years”, when IBM represented a larger portion of the market than Apple at the end of 2019 (5.8% vs. 4.1%).
As we see in Exhibit 1, it is not particularly unusual for the market to be concentrated in a handful of stocks. The combined market capitalization weight of the 10 largest stocks, just over 20% at the end of last year, has been higher in the past.
Exhibit 1: Same Old Story
Weight of largest stocks by market capitalization in US stock market, 1927–2019
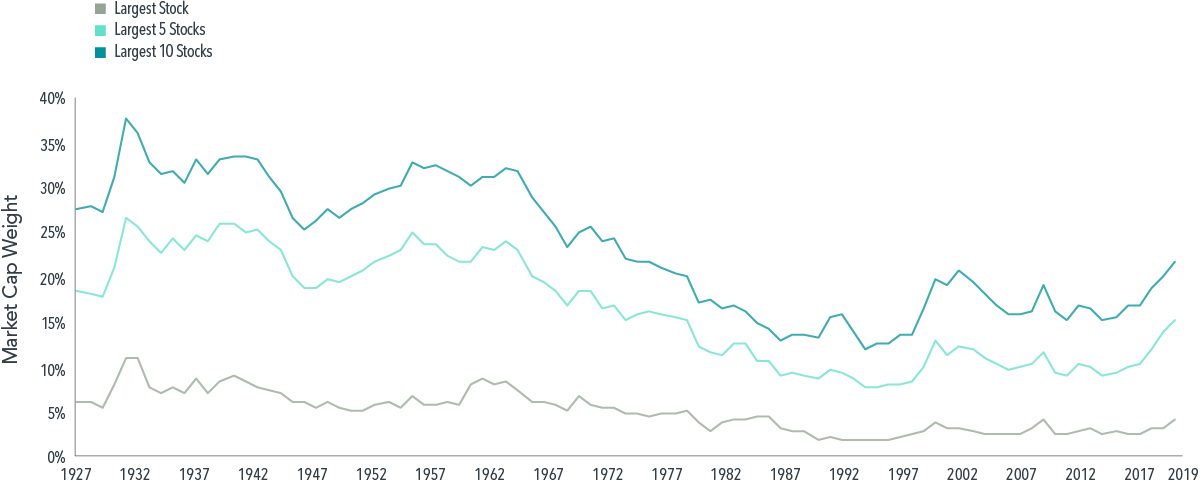
Source: Dimensional, using data from CRSP and Compustat. Includes all US common stocks. Largest stocks identified at the end of each calendar year by sorting stocks on market capitalization. CRSP and Compustat data provided by the Center for Research in Security Prices, University of Chicago.
A breakdown of the largest US stocks by decade in Exhibit 2 shows some companies have stayed on top for a long time. AT&T was among the largest two for six straight decades beginning in 1930. General Motors and General Electric ranked in the top 10 at the start of multiple decades. IBM and Exxon were also mainstays in the second half of the 20th century. Hence, concentration of the stock market in a few large companies such as the FAANG stocks in recent years is not a new normal; it is old normal.
Exhibit 2: Big Board
Largest 10 US stocks at the start of each decade
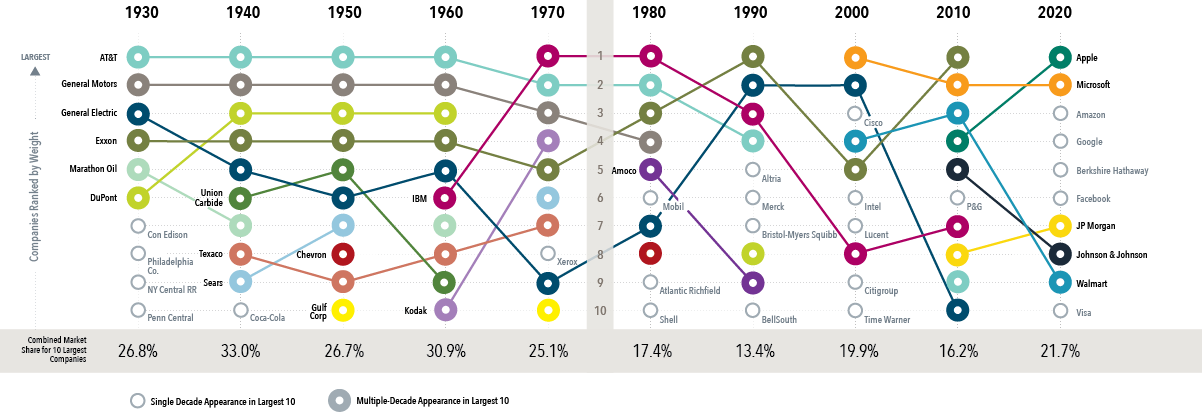
Source: Dimensional, using data from CRSP and Compustat. Includes all US common stocks. Largest stocks identified at the end of the calendar year preceding the respective decade by sorting eligible US stocks on market capitalization using data provided by the Center for Research in Security Prices, University of Chicago.
Moreover, while the definition of “high-tech” is constantly evolving, firms dominating the market have often been on the cutting edge of technology. AT&T offered the first mobile telephone service in 1946. General Motors pioneered such innovations as the electric car starter, airbags, and the automatic transmission. General Electric built upon the original Edison light bulb invention, contributing to further breakthroughs in lighting technology, such as the fluorescent bulb, halogen bulb, and the LED. So technological innovation dominating the stock market is not a new normal; it is an old normal too.
Another trend attributed to a new normal is the extraordinary performance of FAANG stocks over the past decade, leading some to wonder if we should expect these stocks to continue such strong performance going forward. Investors should remember that any expectations about the future operational performance of a firm are already reflected in its current price. While positive developments for the company that exceed current expectations may lead to further appreciation of its stock price, those unexpected changes are not predictable.
To this point, charting the performance of stocks following the year they joined the list of the 10 largest firms shows decidedly less stratospheric results. On average, these stocks outperformed the market by an annualized 0.7% in the subsequent three-year period. Over five- and 10-year periods, these stocks underperformed the market on average.
Exhibit 3: Power Down
Annualized return in excess of market for stocks after joining list of 10 largest US stocks, 1927–2019
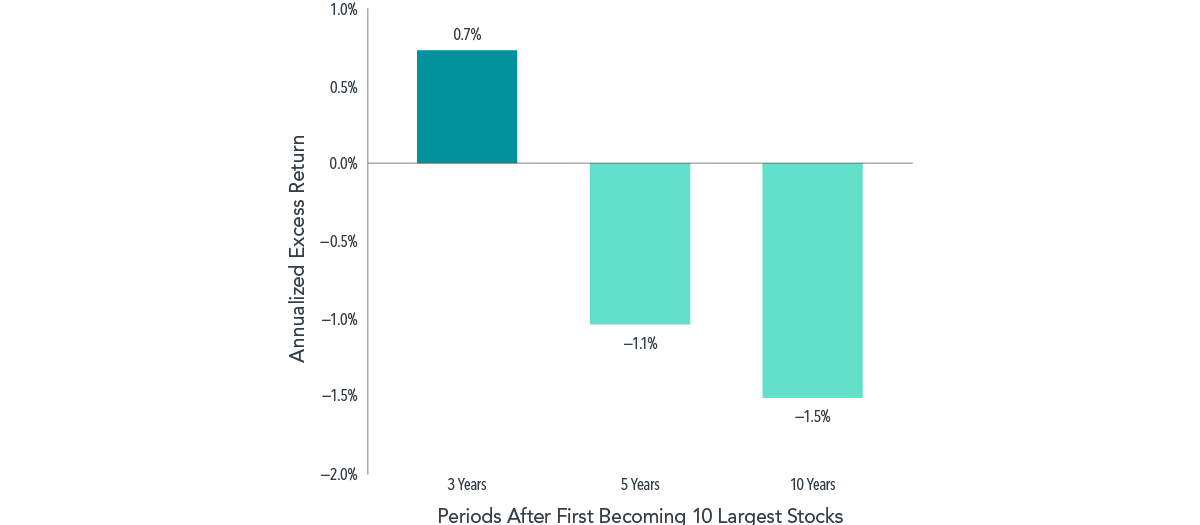
Source: Dimensional, using data from CRSP and Compustat. Includes all US common stocks. Largest stocks identified at the end of each calendar year by sorting eligible US stocks on market capitalization using data from CRSP. Market is represented by the Fama/French Total US Market Research Index. Excess return for each stock is the difference in annualized compound returns between the stock and the market, computed from the first month following initial classification in the top 10. Stocks in the sample are required to have at least 36 months of returns data following classification in the top 10.
Past performance is no guarantee of future results.
The only constant is change, and the more things change the more they stay the same. This seems an apt description of the dominant stocks atop the market. While the types of businesses most prominent in the market vary through time, the fact that a small subset of companies’ stocks account for an outsized portion of the stock market is not new. And it remains impossible to systematically predict which large companies will outperform the stock market and which will underperform it. This underscores the importance of having a broadly diversified equity portfolio that provides exposure to a vast array of companies and sectors.
Glossary
Fama/French Total US Market Research Index: The value-weighed US market index is constructed every month, using all issues listed on the NYSE, AMEX, or Nasdaq with available outstanding shares and valid prices for that month and the month before. Exclusions: American depositary receipts. Sources: CRSP for value-weighted US market return. Rebalancing: Monthly. Dividends: Reinvested in the paying company until the portfolio is rebalanced.
1Facebook, Amazon, Apple, Netflix, and Google (a subsidiary of Alphabet) are often referred to as the FAANG stocks.
The information in this document is provided in good faith without any warranty and is intended for the recipient’s background information only. It does not constitute investment advice, recommendation, or an offer of any services or products for sale and is not intended to provide a sufficient basis on which to make an investment decision. It is the responsibility of any persons wishing to make a purchase to inform themselves of and observe all applicable laws and regulations. Unauthorized copying, reproducing, duplicating, or transmitting of this document are strictly prohibited. Dimensional accepts no responsibility for loss arising from the use of the information contained herein.
“Dimensional” refers to the Dimensional separate but affiliated entities generally, rather than to one particular entity. These entities are Dimensional Fund Advisors LP, Dimensional Fund Advisors Ltd., Dimensional Ireland Limited, DFA Australia Limited, Dimensional Fund Advisors Canada ULC, Dimensional Fund Advisors Pte. Ltd, Dimensional Japan Ltd., and Dimensional Hong Kong Limited. Dimensional Hong Kong Limited is licensed by the Securities and Futures Commission to conduct Type 1 (dealing in securities) regulated activities only and does not provide asset management services.
Dimensional Fund Advisors LP is an investment advisor registered with the Securities and Exchange Commission.
Disclosure: Please remember that past performance may not be indicative of future results. Different types of investments involve varying degrees of risk, and there can be no assurance that the future performance of any specific investment, investment strategy, or product (including the investments and/or investment strategies recommended or undertaken by Versant Capital Management, Inc.), or any non-investment related content, made reference to directly or indirectly in this article will be profitable, equal any corresponding indicated historical performance level(s), be suitable for your portfolio or individual situation, or prove successful. Due to various factors, including changing market conditions and/or applicable laws, the content may no longer be reflective of current opinions or positions. Moreover, you should not assume that any discussion or information contained in this article serves as the receipt of, or as a substitute for, personalized investment advice from Versant Capital Management, Inc. To the extent that a reader has any questions regarding the applicability of any specific issue discussed above to his/her individual situation, he/she is encouraged to consult with the professional advisor of his/her choosing. Versant Capital Management, Inc. is neither a law firm nor a certified public accounting firm and no portion of the article content should be construed as legal or accounting advice. If you are a Versant Capital Management, Inc. client, please remember to contact Versant Capital Management, Inc., in writing, if there are any changes in your personal/financial situation or investment objectives for the purpose of reviewing/evaluating/revising our previous recommendations and/or services. A copy of the Versant Capital Management, Inc.’s current written disclosure statement discussing our advisory services and fees is available upon request.