Ins and Outs of Emerging Markets Investing: Market Behavior and Evolution
By Karen Umland, Senior Investment Director and Vice President | Ethan Wren, Senior Portfolio Manager and Vice President | Dimensional
Emerging markets are an important part of a well-diversified global equity portfolio. However, recent history reminds us that they can be volatile and can perform differently than developed markets. In this article, we provide a longer historical perspective on the performance of emerging markets and the countries that constitute them. We also describe the emerging markets opportunity set and how it has evolved in recent years.
Recent Performance in Perspective
In recent years, the returns of emerging markets have lagged behind those of developed markets. As shown in Exhibit 1, over the past 10 years (2010–2019) the MSCI Emerging Markets Index (net div.) had an annualized compound return of 3.7%, compared to 5.3% for the MSCI World ex USA Index (net div.) and 13.6% for the S&P 500 Index. While recent returns have been disappointing, it is not uncommon to see extended periods when emerging markets perform differently than developed markets. For example, just looking back to the prior decade (2000–2009), emerging markets strongly outperformed developed markets, with the MSCI Emerging Markets Index (net div.) posting an annualized compound return of 9.8%, compared to 1.6% for the MSCI World ex USA Index and –0.95% for the S&P 500 Index.
EXHIBIT 1
A Tale of Two Decades
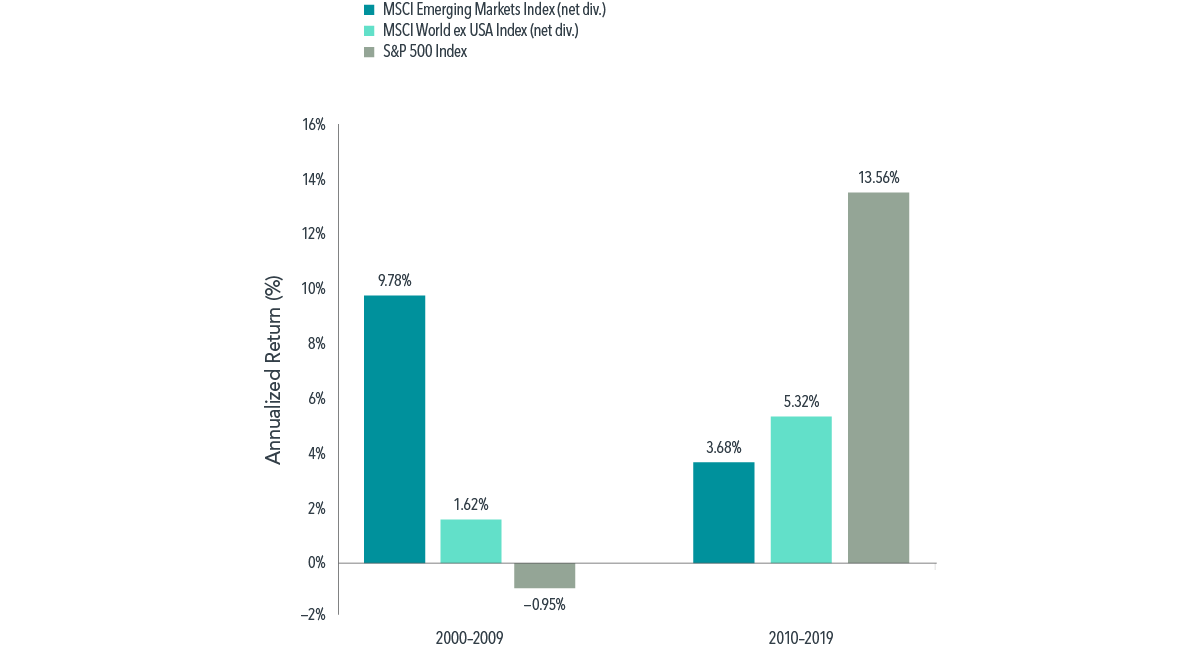
In USD. Past performance is not a guarantee of future results.
The magnitude of the return differences from year to year can be large. For example, relative to the US, the biggest underperformance in the past 10 years was in 2013, when emerging markets underperformed by over 34 percentage points. Exhibit 2 helps to put this difference into historical context: between 1988 and 2019, emerging markets outperformed US stocks by 34 percentage points or more per year four times (1993, 1999, 2007, and 2009) and underperformed US stocks by that same magnitude four times (1995, 1997, 1998, and 2013).
EXHIBIT 2
Relative Calendar Year Performance, 1988-2019
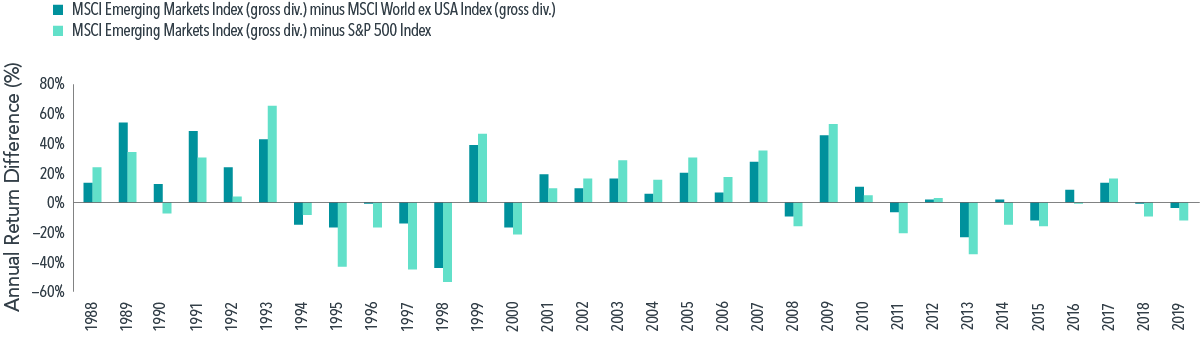
In USD. Past performance is not a guarantee of future results.
Over the entire period from 1988 to 2019, investors with a consistent allocation to emerging markets were rewarded. The MSCI Emerging Markets Index (gross div.) had an annualized return of 10.7% over this period. That exceeded the 5.9% annualized return for the MSCI World ex USA Index (gross div.) and was similar to the 10.8% average annualized return for the S&P 500, even when including the recent decade of strong performance of the US equity market. However, emerging markets returns were also more volatile. Looking at the same indices, the annualized standard deviation was higher for emerging markets: 22.4% vs. 14.1% for the US and 16.4% for developed markets outside the US.This higher volatility, as well as the potentially sizable performance deviation from developed markets, underscores the importance of patience, discipline, and an appropriate allocation that investors can stick with when considering investing in emerging markets.
A Closer Look at Emerging Markets Country Performance
Diversification across emerging markets countries can improve the reliability of investment outcomes, as dispersion among country returns can be wide. Exhibit 3 displays individual emerging markets country returns by calendar year for the past two decades. Each country is represented by a different color, and countries are ranked each year from the highest to lowest performer. In the 20 years ended December 2019, no country had the worst-performing market for more than two consecutive years, and no country had the best-performing market in consecutive years. The illustration shows that country performance is volatile and that countries that rank low in one year may rank among the highest performers in the next year.
EXHIBIT 3
Emerging Markets Country Returns, 2000-2019
Equity Returns of Emerging Markets
Annual Return %
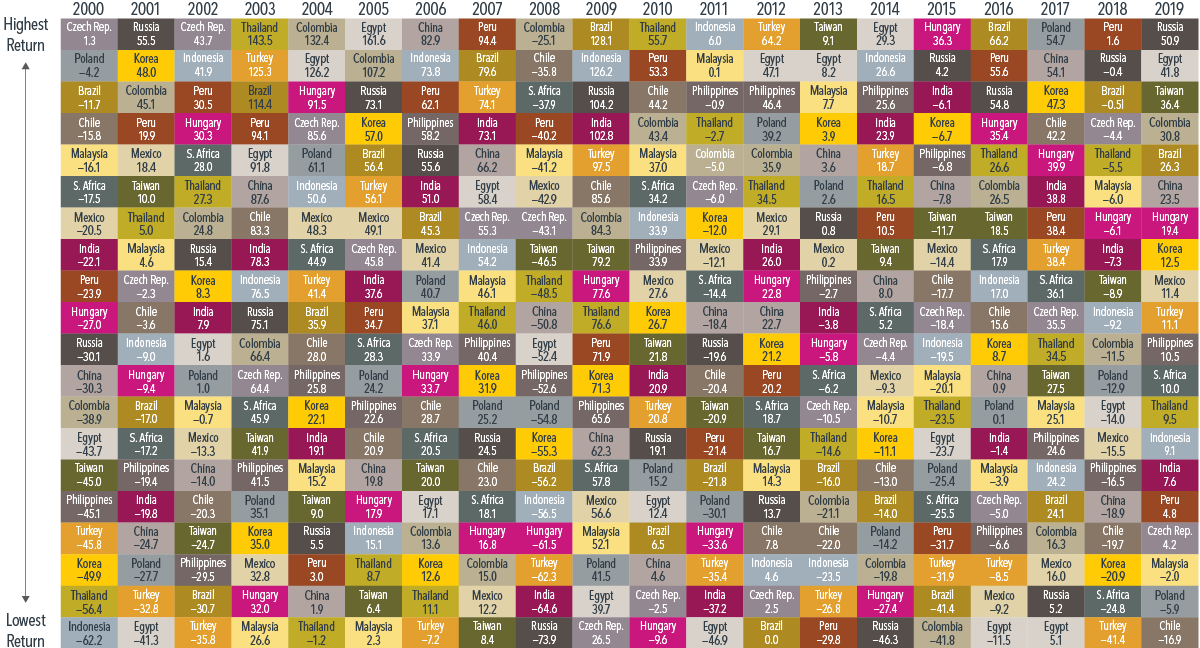
In USD. Past performance is not a guarantee of future results.
Focusing on the countries at the top and bottom of the columns for each year reveals substantial differences in returns between the best-performing and worst-performing market. Exhibit 4 shows that, over the past two decades, the annual return difference between the best- and worst-performing emerging markets has ranged from 39 percentage points in 2013 to 159 percentage points in 2005. On average, that difference has been approximately 80 percentage points per year. Perhaps somewhat counterintuitively, the extreme performers were not necessarily dominated by a handful of countries or by the smaller countries. In fact, 13 different countries were the worst annual performers, and similarly, 13 different countries were the best annual performers. These data illustrate the extreme outcomes that investors may be exposed to by concentrating in a few countries. There is no compelling evidence that investors can reliably add value through dynamic country allocation.1 By holding a broadly diversified portfolio, investors are instead well positioned to capture returns wherever they occur.
EXHIBIT 4
Best- and Worst-Performing Markets Over Last Two Decades
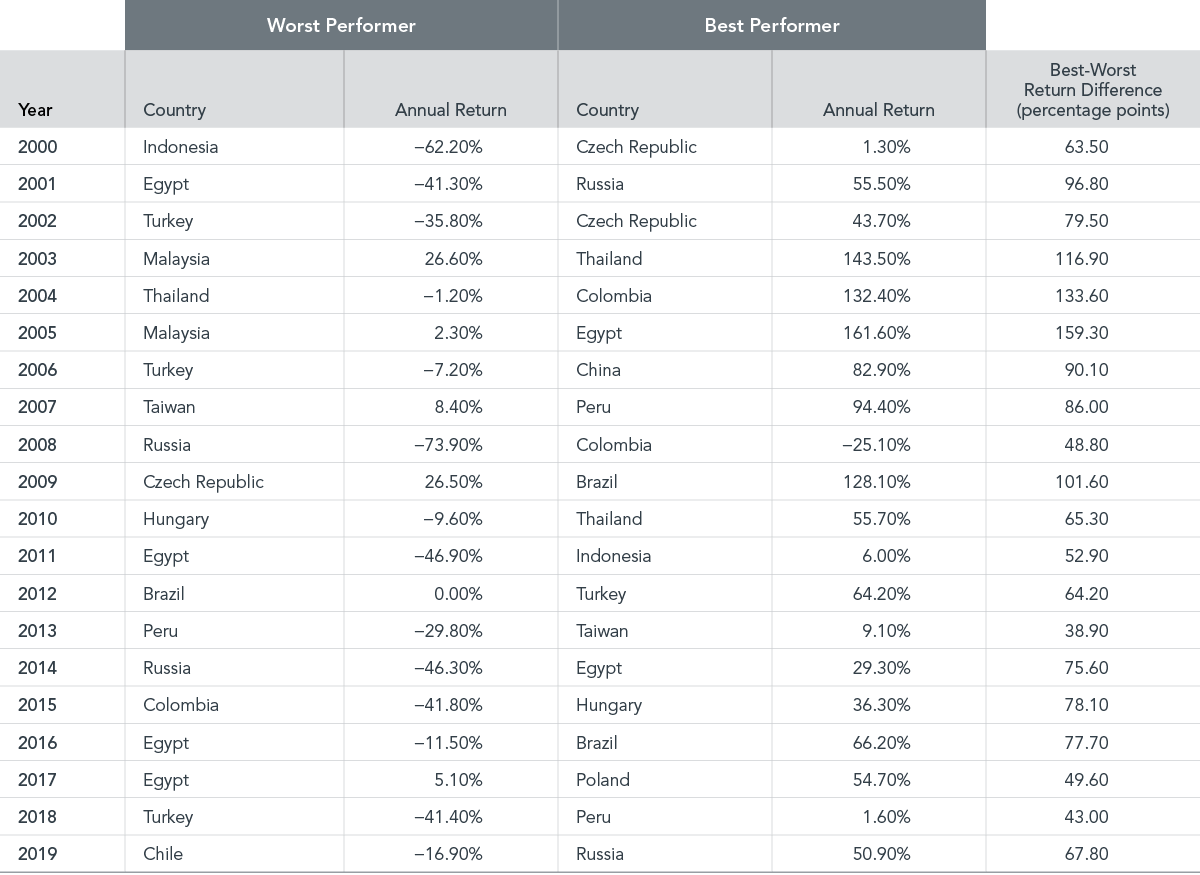
In USD. Past performance is not a guarantee of future results.
As a group, emerging markets represent a meaningful opportunity set for investors. The size and composition of the investible universe of emerging markets have steadily evolved since the late 1980s, when most comprehensive data sets and benchmarks for emerging markets begin. Over the years, major geopolitical, economic, and demographic changes have contributed to shifting weights for individual countries and companies within emerging markets, but in aggregate they have continued to grow.
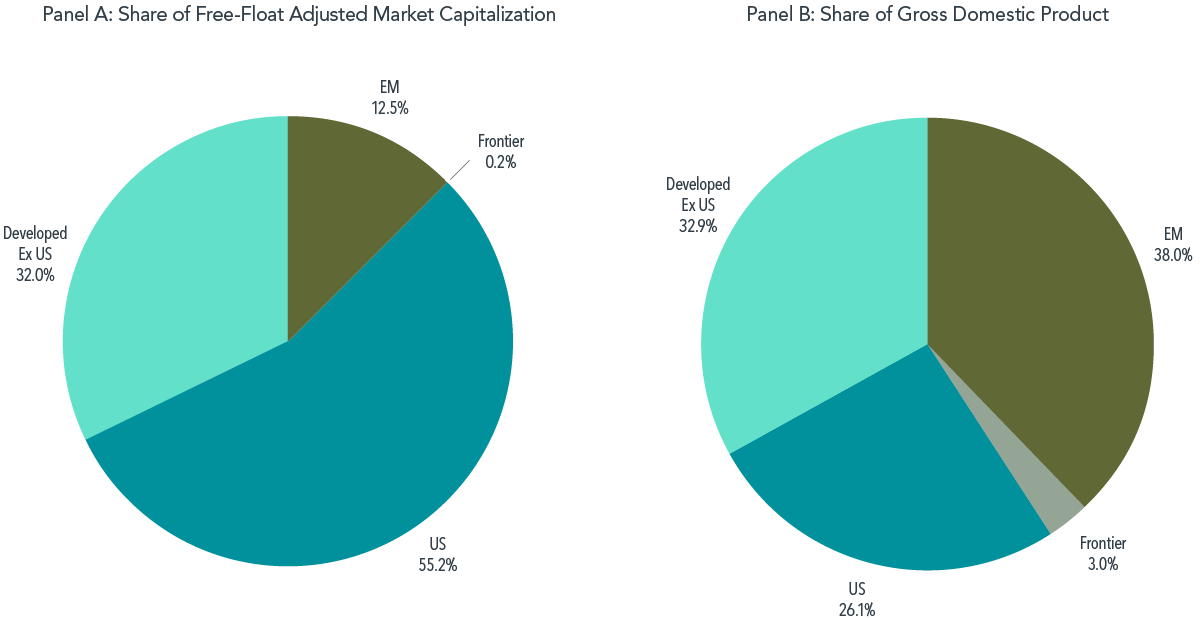
As of the end of 2019, the total free-float adjusted market capitalization of Dimensional’s emerging markets universe was $7.8 trillion and included 24 countries and over 7,000 securities. As shown in Panel A of Exhibit 5, emerging markets represented 12.5% of global markets’ free-float adjusted market capitalization. Measured by gross domestic product (GDP), emerging markets’ share increases to 38.0% (Panel B), reflecting the fact that emerging markets typically have smaller market capitalizations compared to GDP than most developed markets. Regardless of the metric, emerging markets represent a significant component of global markets.
EXHIBIT 5
Emerging Markets as a Percentage of the World as of December 31, 2019
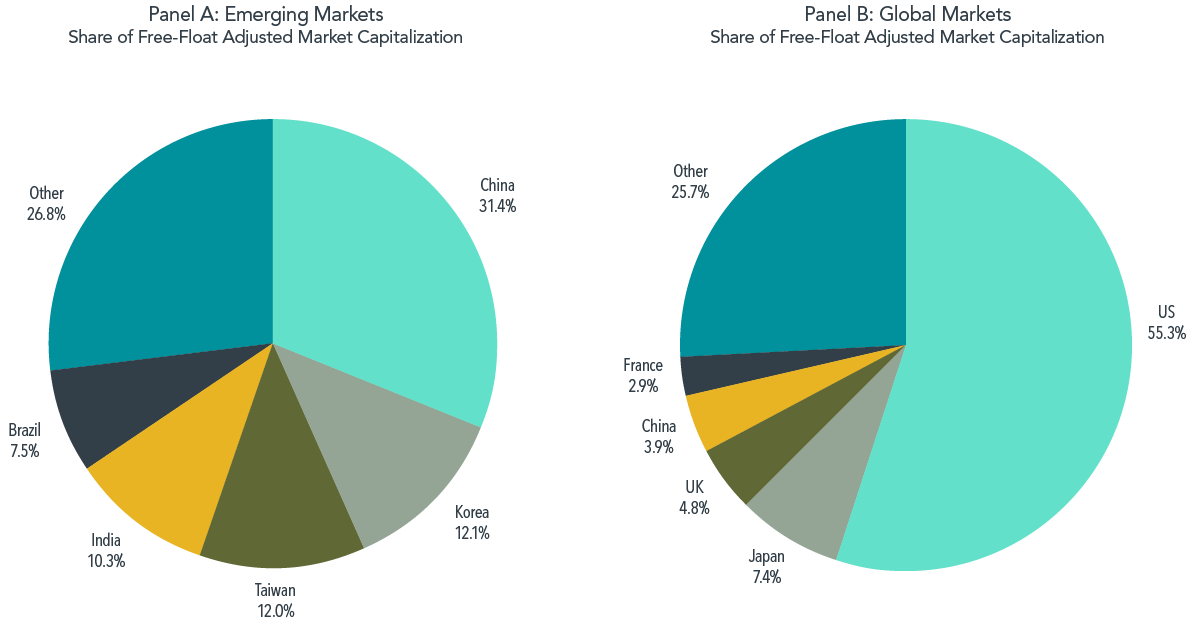
Panel A of Exhibit 6 examines the country composition of Dimensional’s emerging markets universe. The top five countries in terms of market capitalization—Brazil, China, India, Korea, and Taiwan—represented 73.2% at the end of 2019, slightly higher than at the beginning of the decade, when these same five countries represented 68.8% of the universe. A more significant development over the past decade has been the rise in the weight of China, from 17.2% of the universe at the end of 2009 to 31.4% at the end of 2019. This increase has been driven primarily by new equity issuance and new avenues for foreign investors to gain exposure to Chinese companies, including securities listed on the local Shanghai and Shenzhen stock exchanges through Hong Kong stock connect programs.The growing size of China in the emerging markets has prompted many questions from investors on issues such as benchmarking and concerns about potential concentration. While these issues are complex, it is often helpful to consider China’s weight from a global perspective. Panel B of Exhibit 6 shows the weights of the top five countries in the global universe as of the same date. Compared to its 31.4% weight in the emerging markets universe, China’s weight was 3.9% in the global market, making it the fourth-largest country after the US, Japan, and the UK.
EXHIBIT 6
Top Five Country Weights in Emerging Markets and Global Markets as of December 31, 2019
In addition to changes in size and country composition, emerging markets have undergone important improvements in their market mechanisms and microstructures over the past decade. Generally, emerging markets have become more open to foreign investors with fewer constraints on capital mobility. Evidence of these developments includes fewer instances of market closings, capital lockups, and trading suspensions of individual stocks in many markets. Finally, emerging markets have broadly adopted international accounting and reporting practices over the last decade. Our analysis suggests more than 90% of the firms in most emerging markets now report their annual financial statements according to International Financial Reporting Standards (IFRS) or US Generally Accepted Accounting Practices (GAAP). In countries like China, India, and Taiwan, the national standards have substantially converged with IFRS. This has helped improve the reliability and transparency of financial data in emerging markets.
Summary
In sum, emerging markets represent a meaningful opportunity set within global markets. They continue to evolve in their structures, market mechanisms, and accessibility. Investors in emerging markets can benefit from a long-term perspective, expertise and flexibility in navigating these changing markets, and an approach that emphasizes diversification and discipline.
FOOTNOTES
1James L. Davis, “Mean Reversion in the Dimensions of Expected Stock Returns” (white paper, Dimensional Fund Advisors, 2014).
APPENDIX
Eligible Universe Information
Source: Dimensional, using CRSP and Bloomberg. Data is as of December 31, 2019. Country eligibility determined by Dimensional for developed and emerging markets, and by MSCI classification for frontier markets. Market cap data is free-float adjusted and meets minimum liquidity and listing requirements. Minimum liquidity is $50K median daily volume in the current month, and minimum total market capitalization is $10MM for the US and $50MM elsewhere. Includes equity and REIT securities. China A-Shares only includes those trading on Hong Kong Stock Connect, at a 25% inclusion factor. Totals may not equal 100% due to rounding. For educational purposes; should not be used as investment advice.
Dimensional’s Eligible Emerging Markets Universe: The countries included in Dimensional’s emerging markets universe are as follows: Brazil, Chile, China, Colombia, Czech Republic, Egypt, Greece, Hungary, India, Indonesia, Korea, Malaysia, Mexico, Peru, Philippines, Poland, Qatar, Russia, Saudi Arabia, South Africa, Taiwan, Thailand, Turkey, United Arab Emirates.
Dimensional’s Eligible Global Markets Universe: The countries included in Dimensional’s global universe are as follows: Australia, Austria, Bahrain, Bangladesh, Belgium, Brazil, Canada, Chile, China, Colombia, Croatia, Czech Republic, Denmark, Egypt, Estonia, Finland, France, Germany, Greece, Hong Kong, Hungary, India, Indonesia, Ireland, Israel, Italy, Ivory Coast, Japan, Jordan, Kazakhstan, Korea, Kenya, Kuwait, Lebanon, Lithuania, Malaysia, Mauritius, Mexico, Morocco, Netherlands, New Zealand, Nigeria, Norway, Oman, Peru, Philippines, Poland, Portugal, Qatar, Romania, Russia, Saudi Arabia, Senegal, Serbia, Singapore, Slovenia, South Africa, , Spain, Sri Lanka, Sweden, Switzerland, Taiwan, Thailand, Tunisia, Turkey, United Arab Emirates, UK, US, Vietnam.
Disclosure:
Please remember that past performance may not be indicative of future results. Different types of investments involve varying degrees of risk, and there can be no assurance that the future performance of any specific investment, investment strategy, or product (including the investments and/or investment strategies recommended or undertaken by Versant Capital Management, Inc.), or any non-investment related content, made reference to directly or indirectly in this article will be profitable, equal any corresponding indicated historical performance level(s), be suitable for your portfolio or individual situation, or prove successful. Due to various factors, including changing market conditions and/or applicable laws, the content may no longer be reflective of current opinions or positions. Moreover, you should not assume that any discussion or information contained in this article serves as the receipt of, or as a substitute for, personalized investment advice from Versant Capital Management, Inc. To the extent that a reader has any questions regarding the applicability of any specific issue discussed above to his/her individual situation, he/she is encouraged to consult with the professional advisor of his/her choosing. Versant Capital Management, Inc. is neither a law firm nor a certified public accounting firm and no portion of the article content should be construed as legal or accounting advice. If you are a Versant Capital Management, Inc. client, please remember to contact Versant Capital Management, Inc., in writing, if there are any changes in your personal/financial situation or investment objectives for the purpose of reviewing/evaluating/revising our previous recommendations and/or services. A copy of the Versant Capital Management, Inc.’s current written disclosure statement discussing our advisory services and fees is available upon request.
UNITED STATES: Dimensional Fund Advisors LP is an investment advisor registered with the Securities and Exchange Commission.