[vc_row][vc_column][vc_column_text responsive_align=”left”]
Is national obsession key to worldwide soccer success?
Financial data provides insight about what countries are poised to win future World Cups
Tyler Scott, Research Analyst at Versant Capital Management, Inc.
 The world’s most watched event is well underway, and the American Outlaws – the unofficial fandom for the U.S. men’s national soccer team – are noticeably absent from this year’s competition. Not making it to the World Cup is undoubtedly a disappointment for the team; but historically speaking, it was unlikely that the U.S. would have made it much further than the first stage of the knockout round.
The U.S. has the largest economy in the world and we are indeed a proud and efficient sporting nation. Our Summer Olympic dominance is nearly untouchable. So, what will it take for the U.S. to become a genuinely premier soccer nation and have a realistic chance of winning the golden globe, if ever?
We took a look at a multitude of different data to see what insights could be drawn about the future of soccer and who could be poised to win future World Cups.
The World Cup consists of 32 nations that come from six confederations that are spread across the world and are generally grouped by continent. In this year’s World Cup there are:
14 UEFA teams (Europe)
5 CONMEBOL teams (South America)
5 CAF teams (Africa)
5 AFC teams (Asia)
3 CONCACAF teams (North & Central America plus the Caribbean)
0 OFC teams (Oceania)
These allocations are reasonably representative of the current FIFA world rankings, which have only UEFA and CONMENBOL teams in the top ten. In the top 25 rankings we have 15 UEFA, 6 CONMENBOL, 3 CONCACAF and 1 CAF team. The top 50 in the rankings include 29 UEFA, 8 CONMENBOL, 8 CAF, 3 CONCACAF and 2 AFC teams (Figure 1).
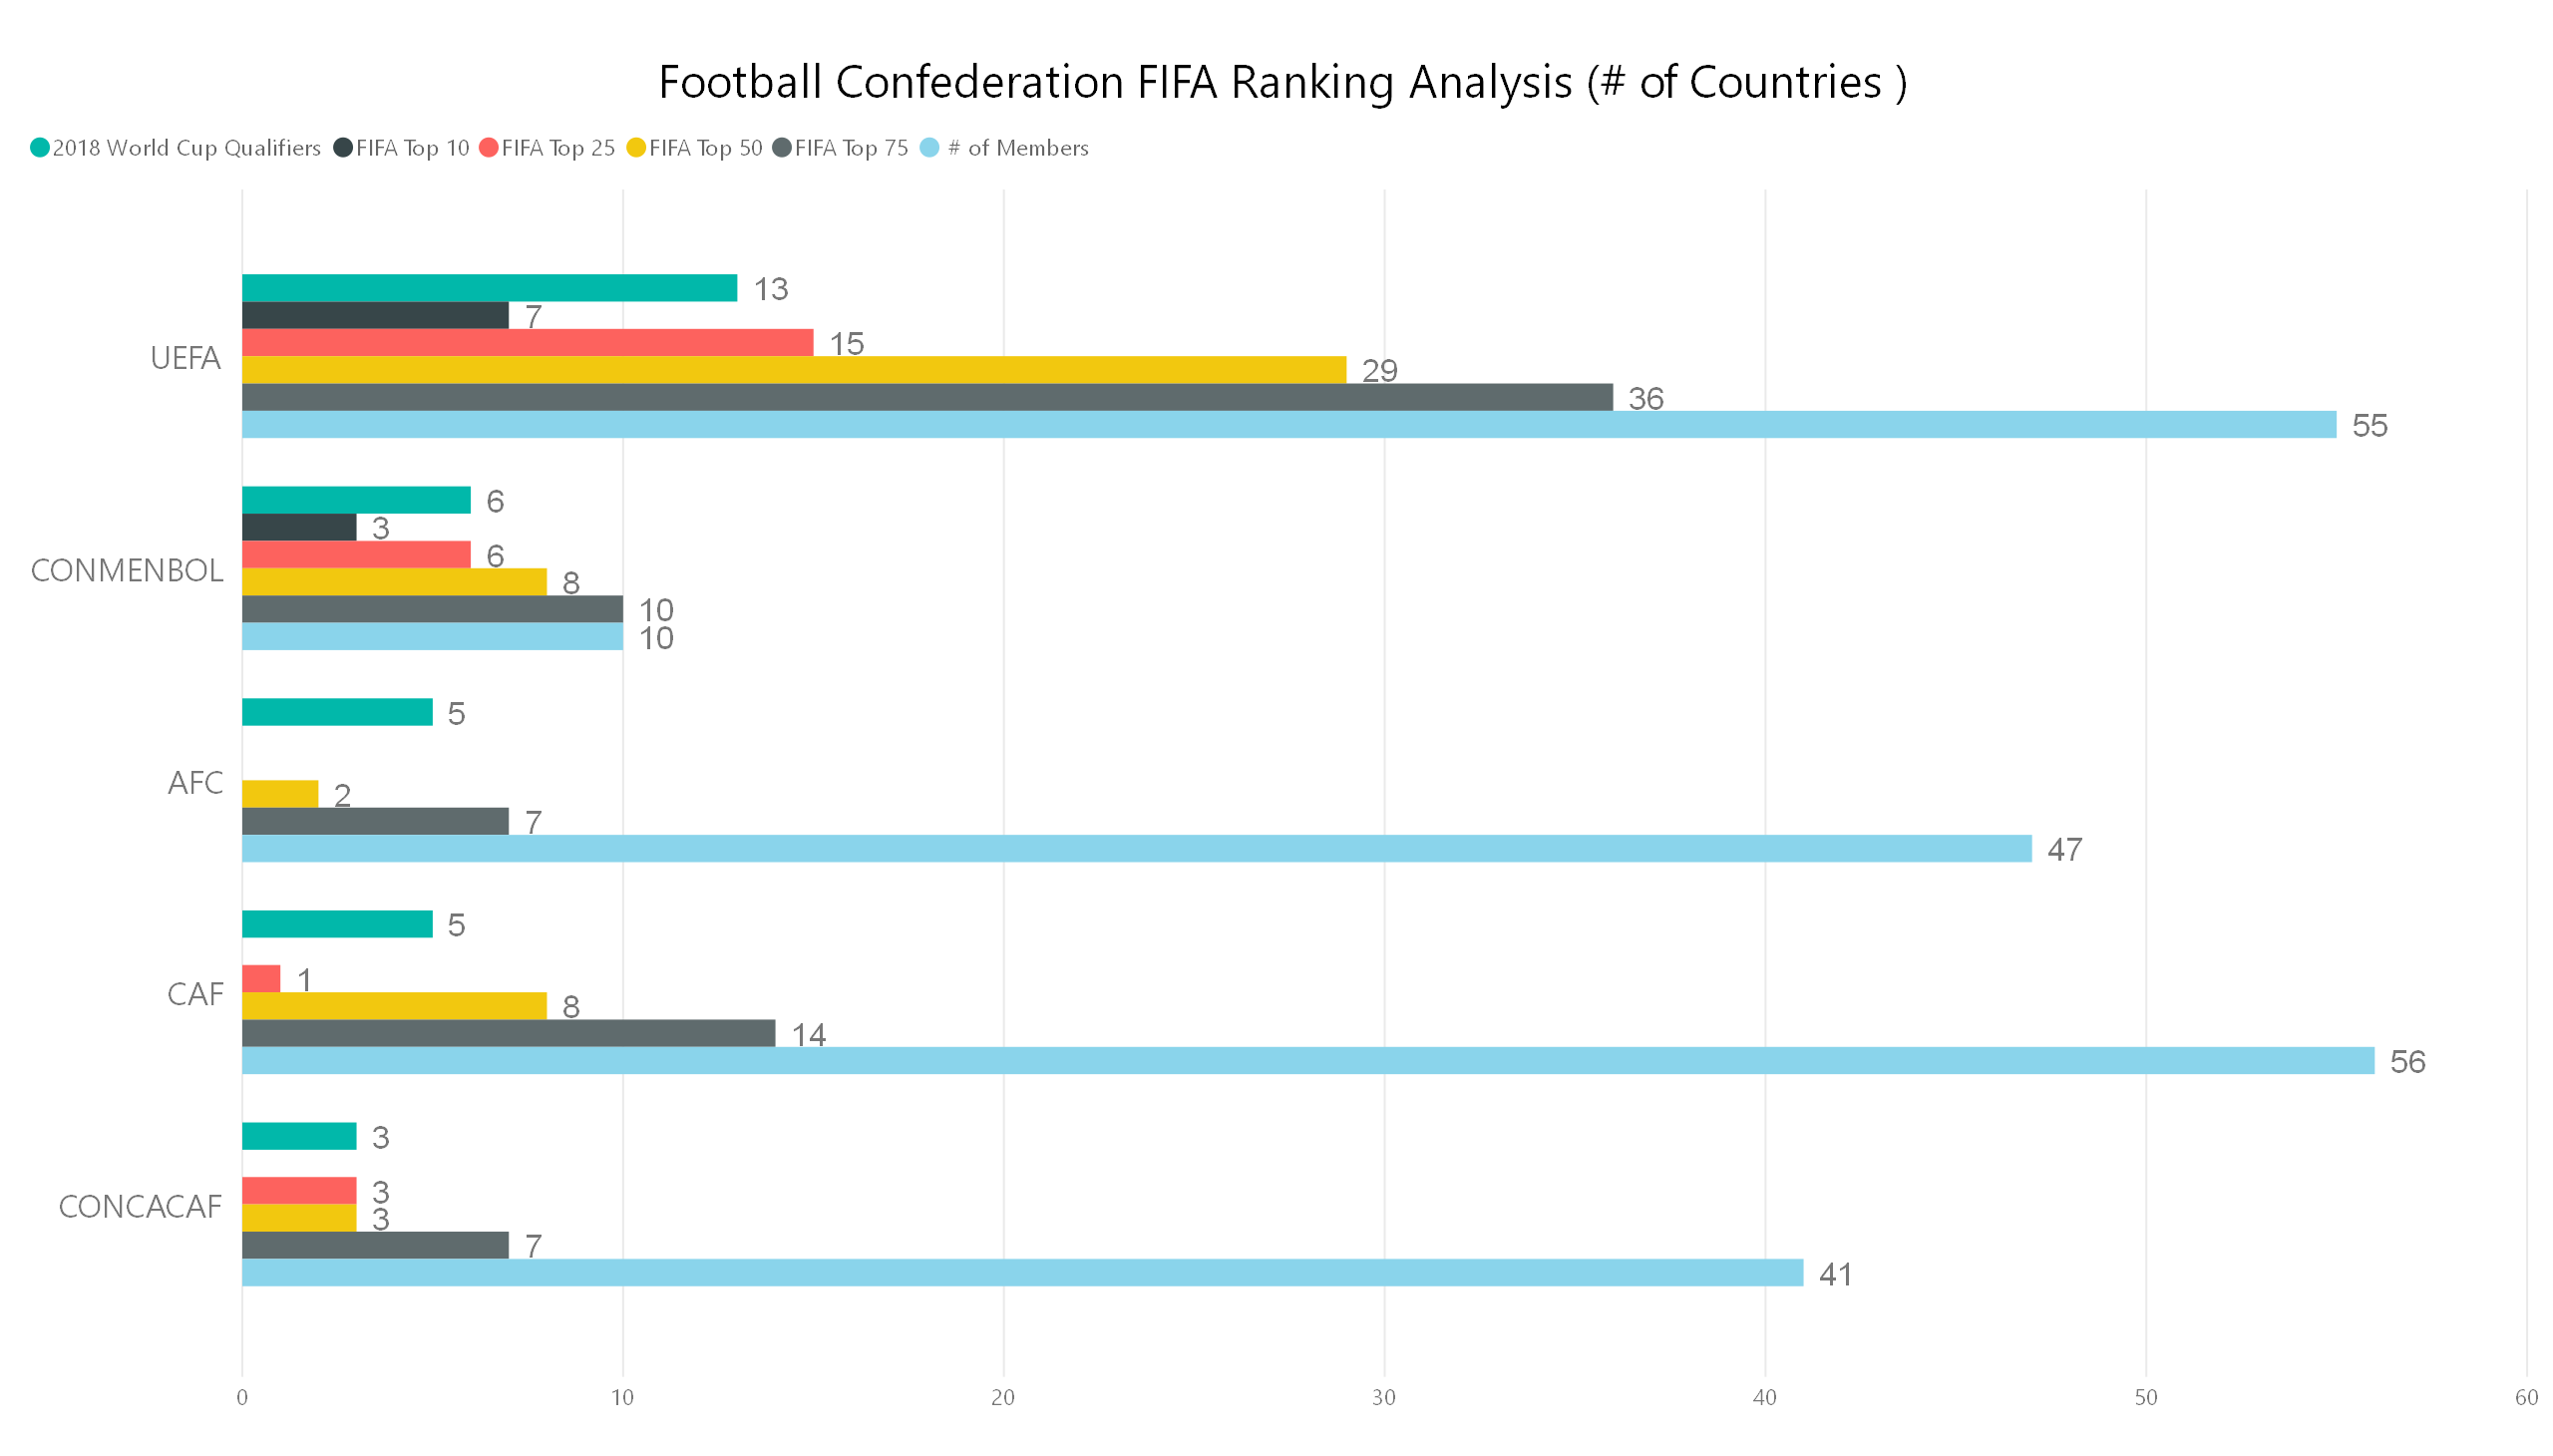
Figure 1- Source: FIFA
The only teams that made this year’s World Cup from outside the top 50 are Russia (the host nation’s team and always an automatic qualifier), 3 AFC teams (South Korea, Japan, Saudi Arabia) and Panama, the CONCACAF team that ousted the U.S. from the World Cup qualification. Europe and South America, both currently and historically, dominate world rankings and World Cup trophies. No other region has made it to a World Cup final or been world champion. What will it take to change that and why are these regions always dominant?
A strong economy could be an indicator for potential success on the soccer pitch, as economies that have more disposable income can dedicate leisure time to sport. However, those nations may not have a real passion for soccer and its population may spend leisure time on other endeavors.
National GDP
When looking directly at the gross domestic product (GDP) per country, the 2018 World Cup’s constituents make up 10 of the 15 largest economies in the world (Figure 2).
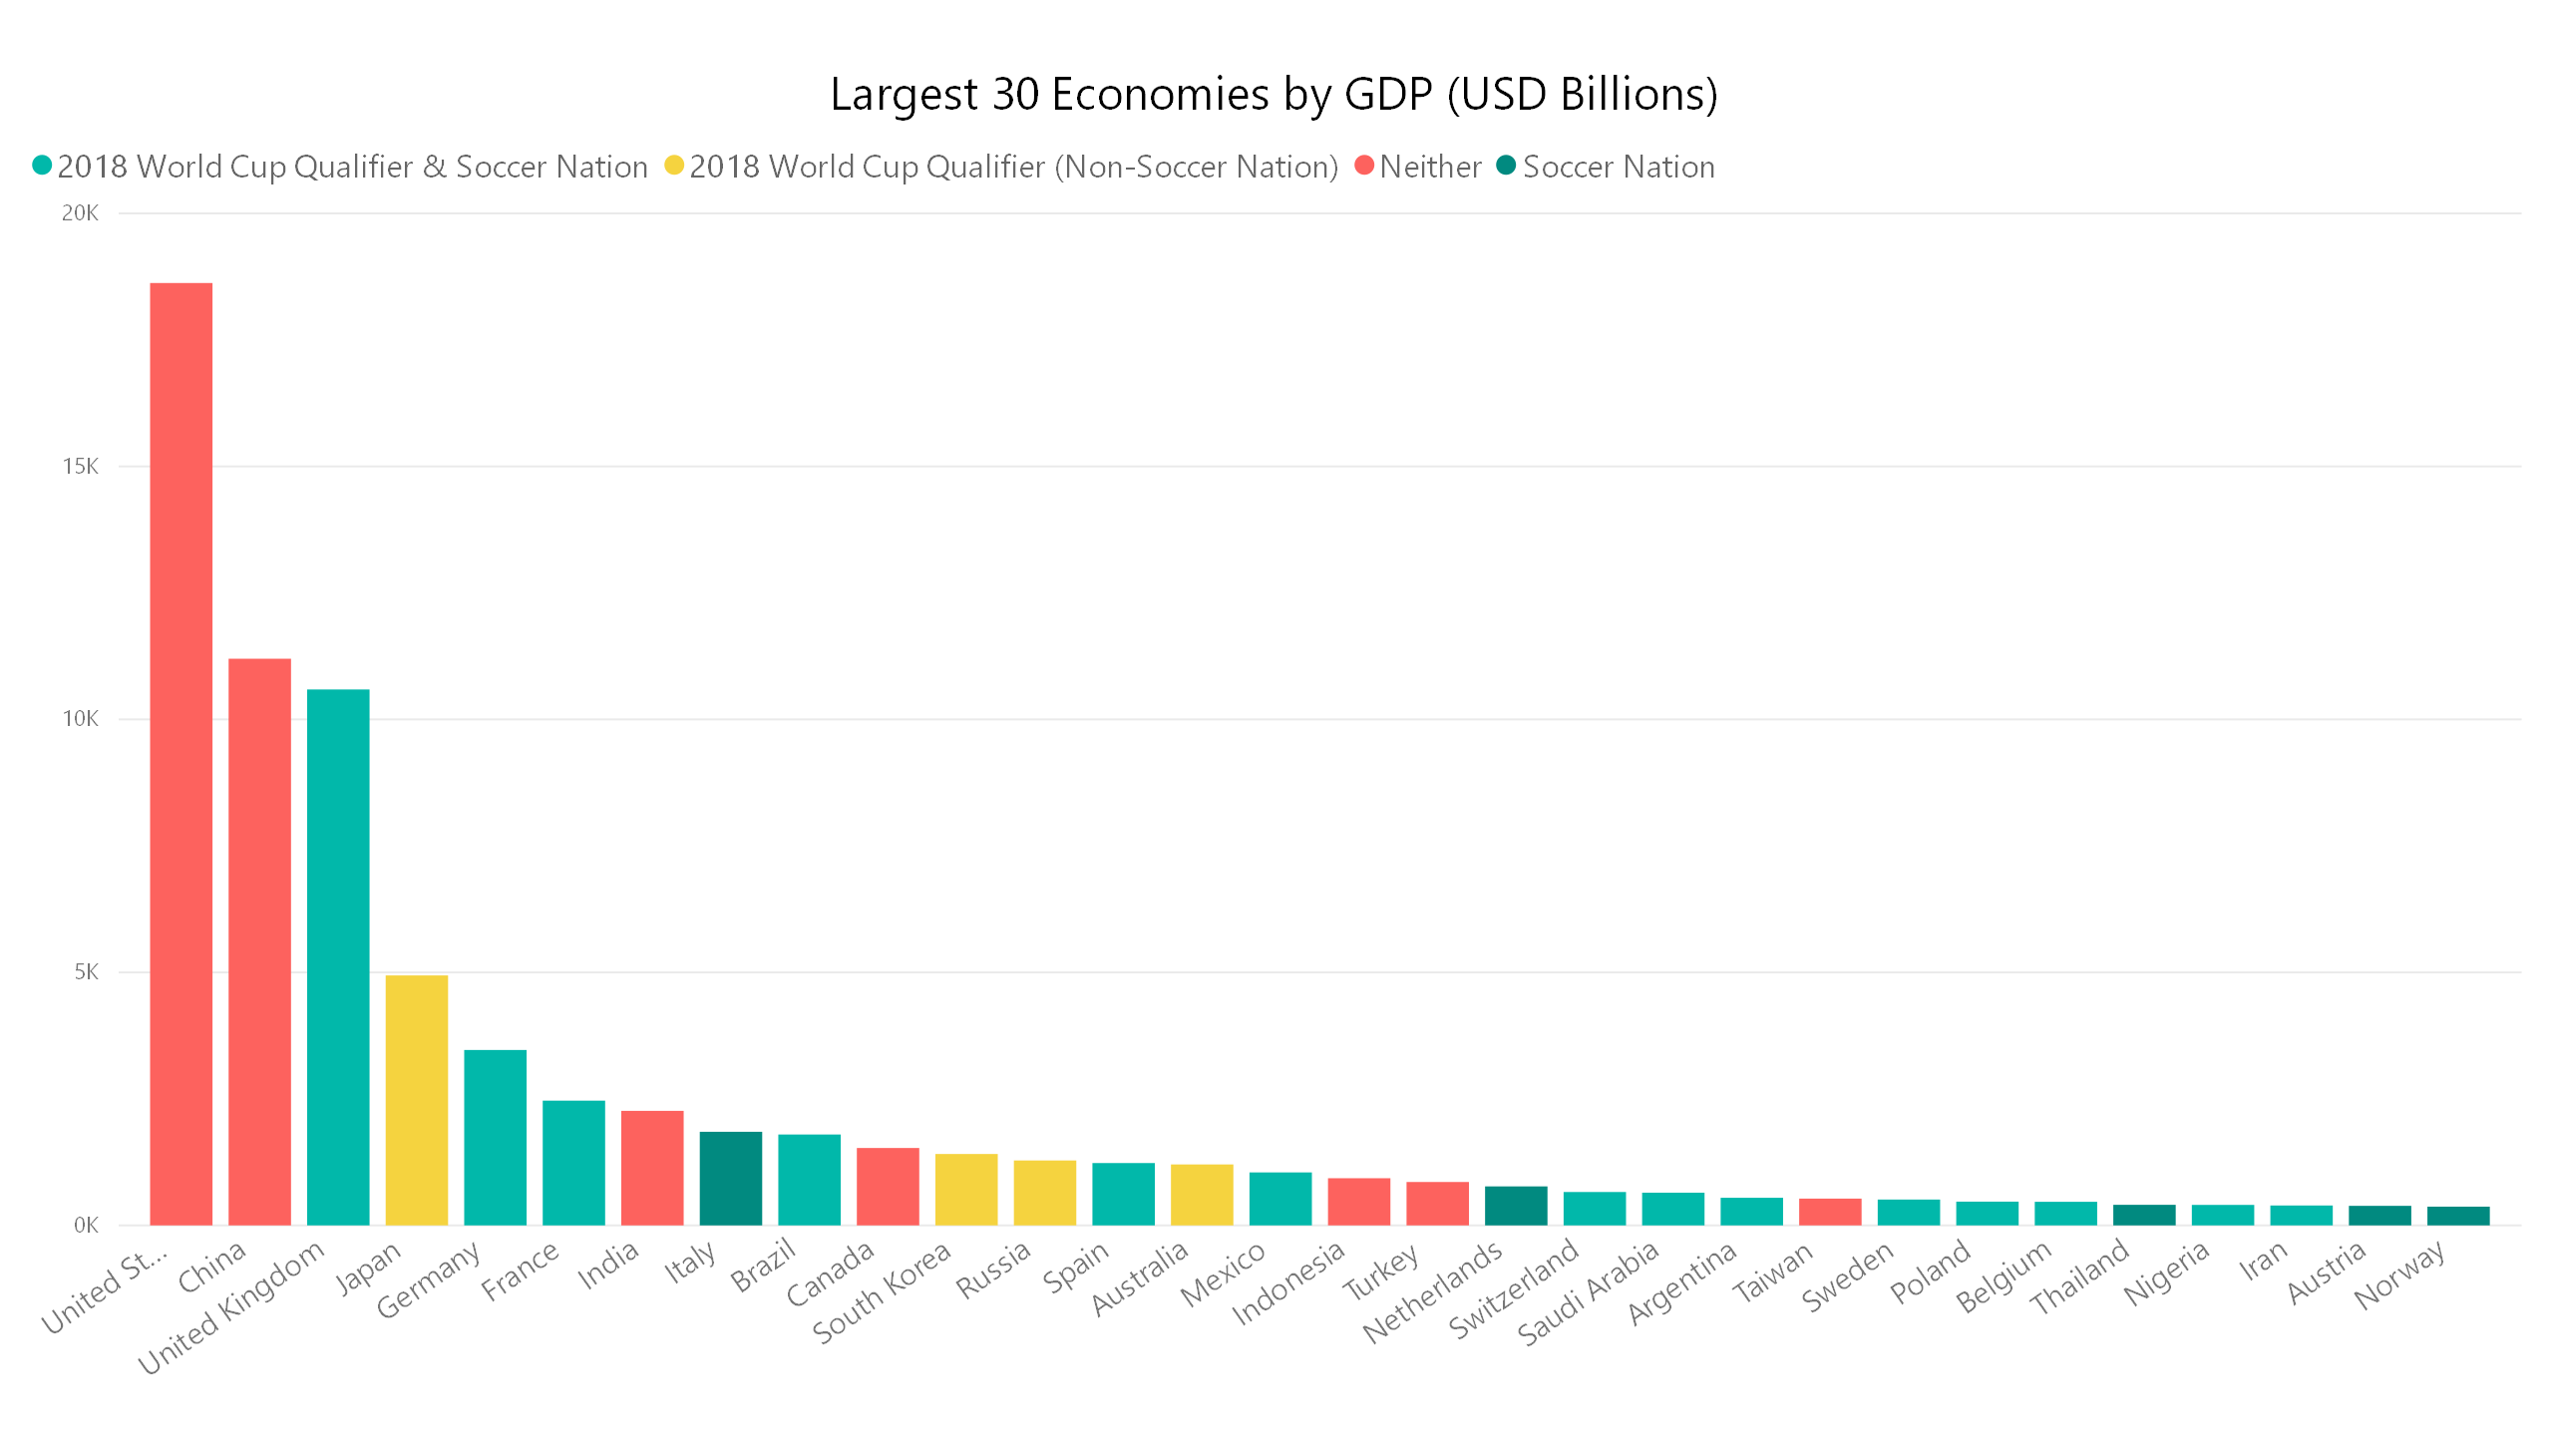
Figure 2- Source: Trading Economics
The countries missing from the World Cup this year are the U.S., China, India, Italy and Canada. Italy is a perennial World Cup contender and is one of only three countries in the world that have won the World Cup more than two times. Soccer is not a participant nor spectator focus in the U.S, China, India or Canada, and is likely why these countries are absent from World Cups (Decierdo, 2017). Even with this lack of interest, the U.S. has managed to qualify for 10 of 21 historical World Cups, and more recently, 7 out of the 8 World Cups since 1990. China and Canada have only qualified for 1 World Cup each, while India has never qualified.
Of the remaining 32 World Cup participants, 8 countries comprise the next 15 largest world economies, making 18 of the 30 largest economies represented in the World Cup. Outside of the top 30 teams, the remaining 12 World Cup qualifiers are ranked all the way down to 120th (Senegal) out of the 181 countries we examined for GDP data. This data indicates that a strong economy certainly can help increase a country’s ranking but may not be a determining factor.
We then looked at which countries are the most efficient with respect to their FIFA world rankings points, divided by each country’s total GDP (Figure 3).

Figure 3- Source: FIFA, Trading Economics
Population’s effect on soccer
If not the sheer size of an economy, the raw population could indicate a country’s potential to produce on the pitch. A number of the most populated countries are competing in the 2018 World Cup, with 7 of the 15 most populated countries and 18 of 45 most populated countries represented (Figure 4).
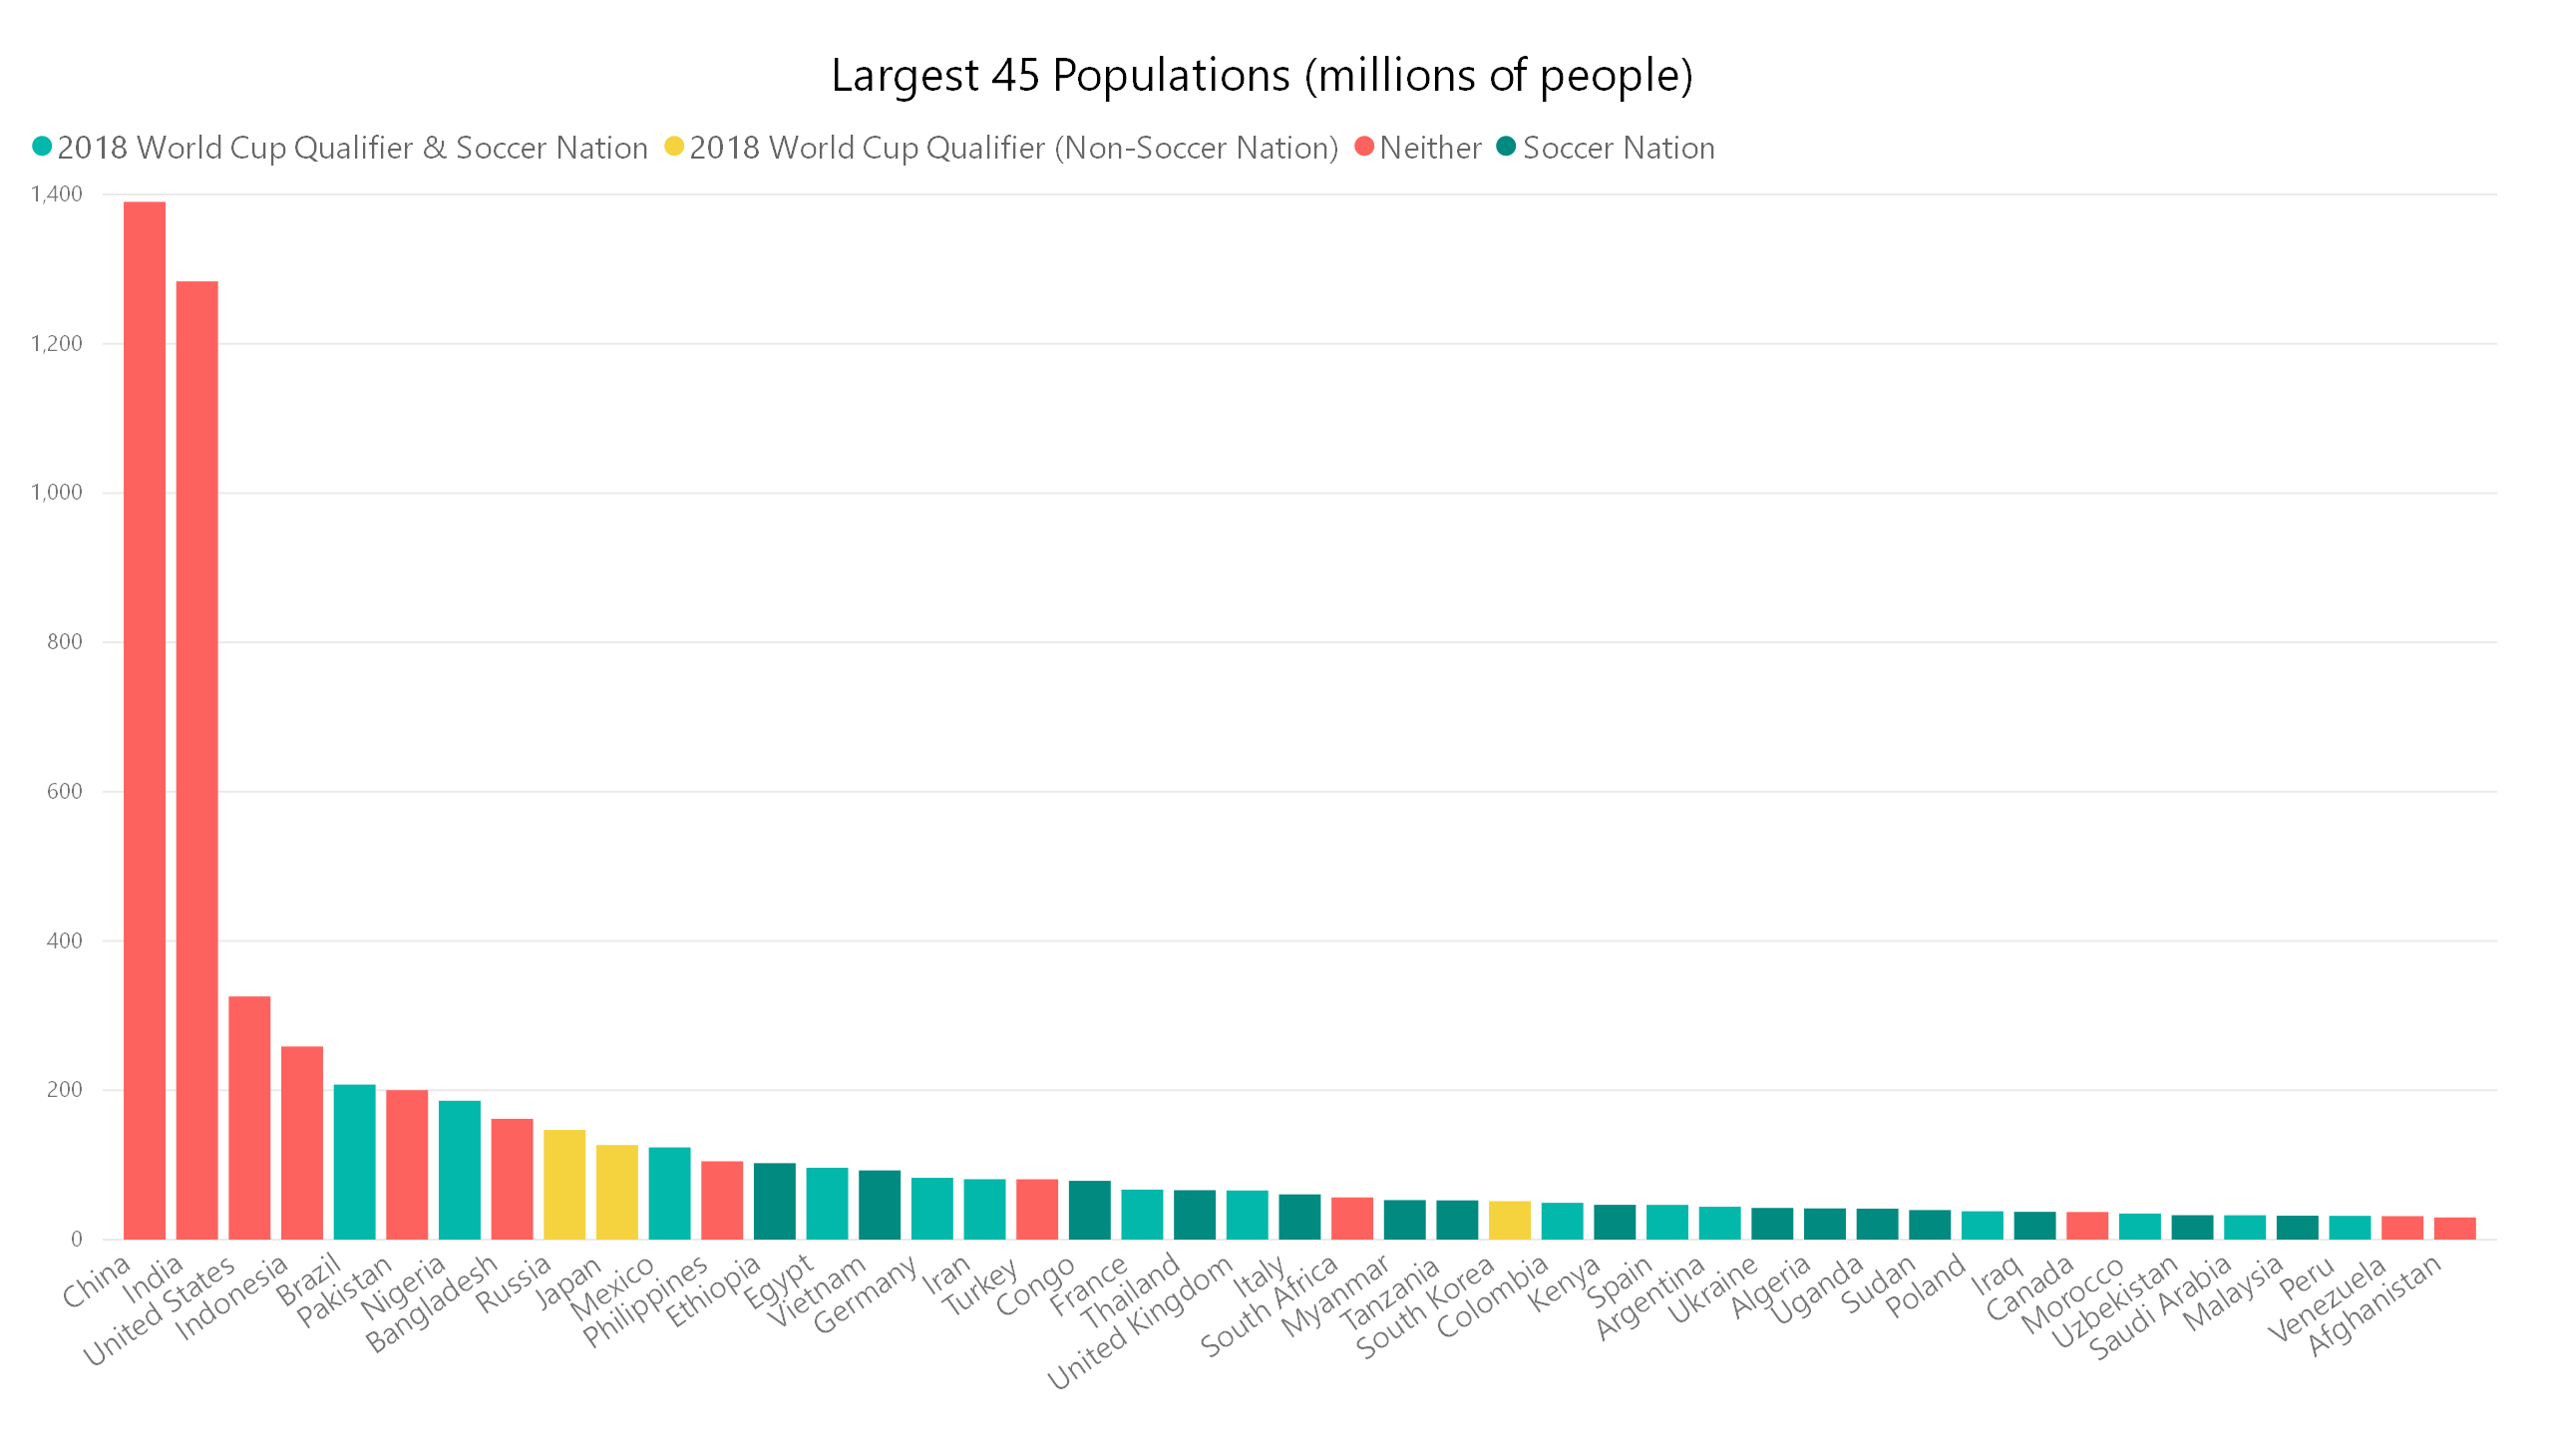
Figure 4- Source: Trading Economics
Outside of the 45 most populated countries there is more population diversity for World Cup qualifiers than there was for GDP. A cluster of four country’s populations (Costa Rica, Croatia, Panama, Uruguay) are ranked 121st through 135th, but are still highly competitive on the pitch. In fact, Croatia and Uruguay will both be in this year’s World Cup quarterfinals and have rosters with world-class players. Iceland – the Cinderella of this year’s event – recently became the least populated nation to qualify for the World Cup. At 340,000 people, Iceland disproves that a soccer nation needs to be highly populated to have an impact at the World Cup (Figure 5).
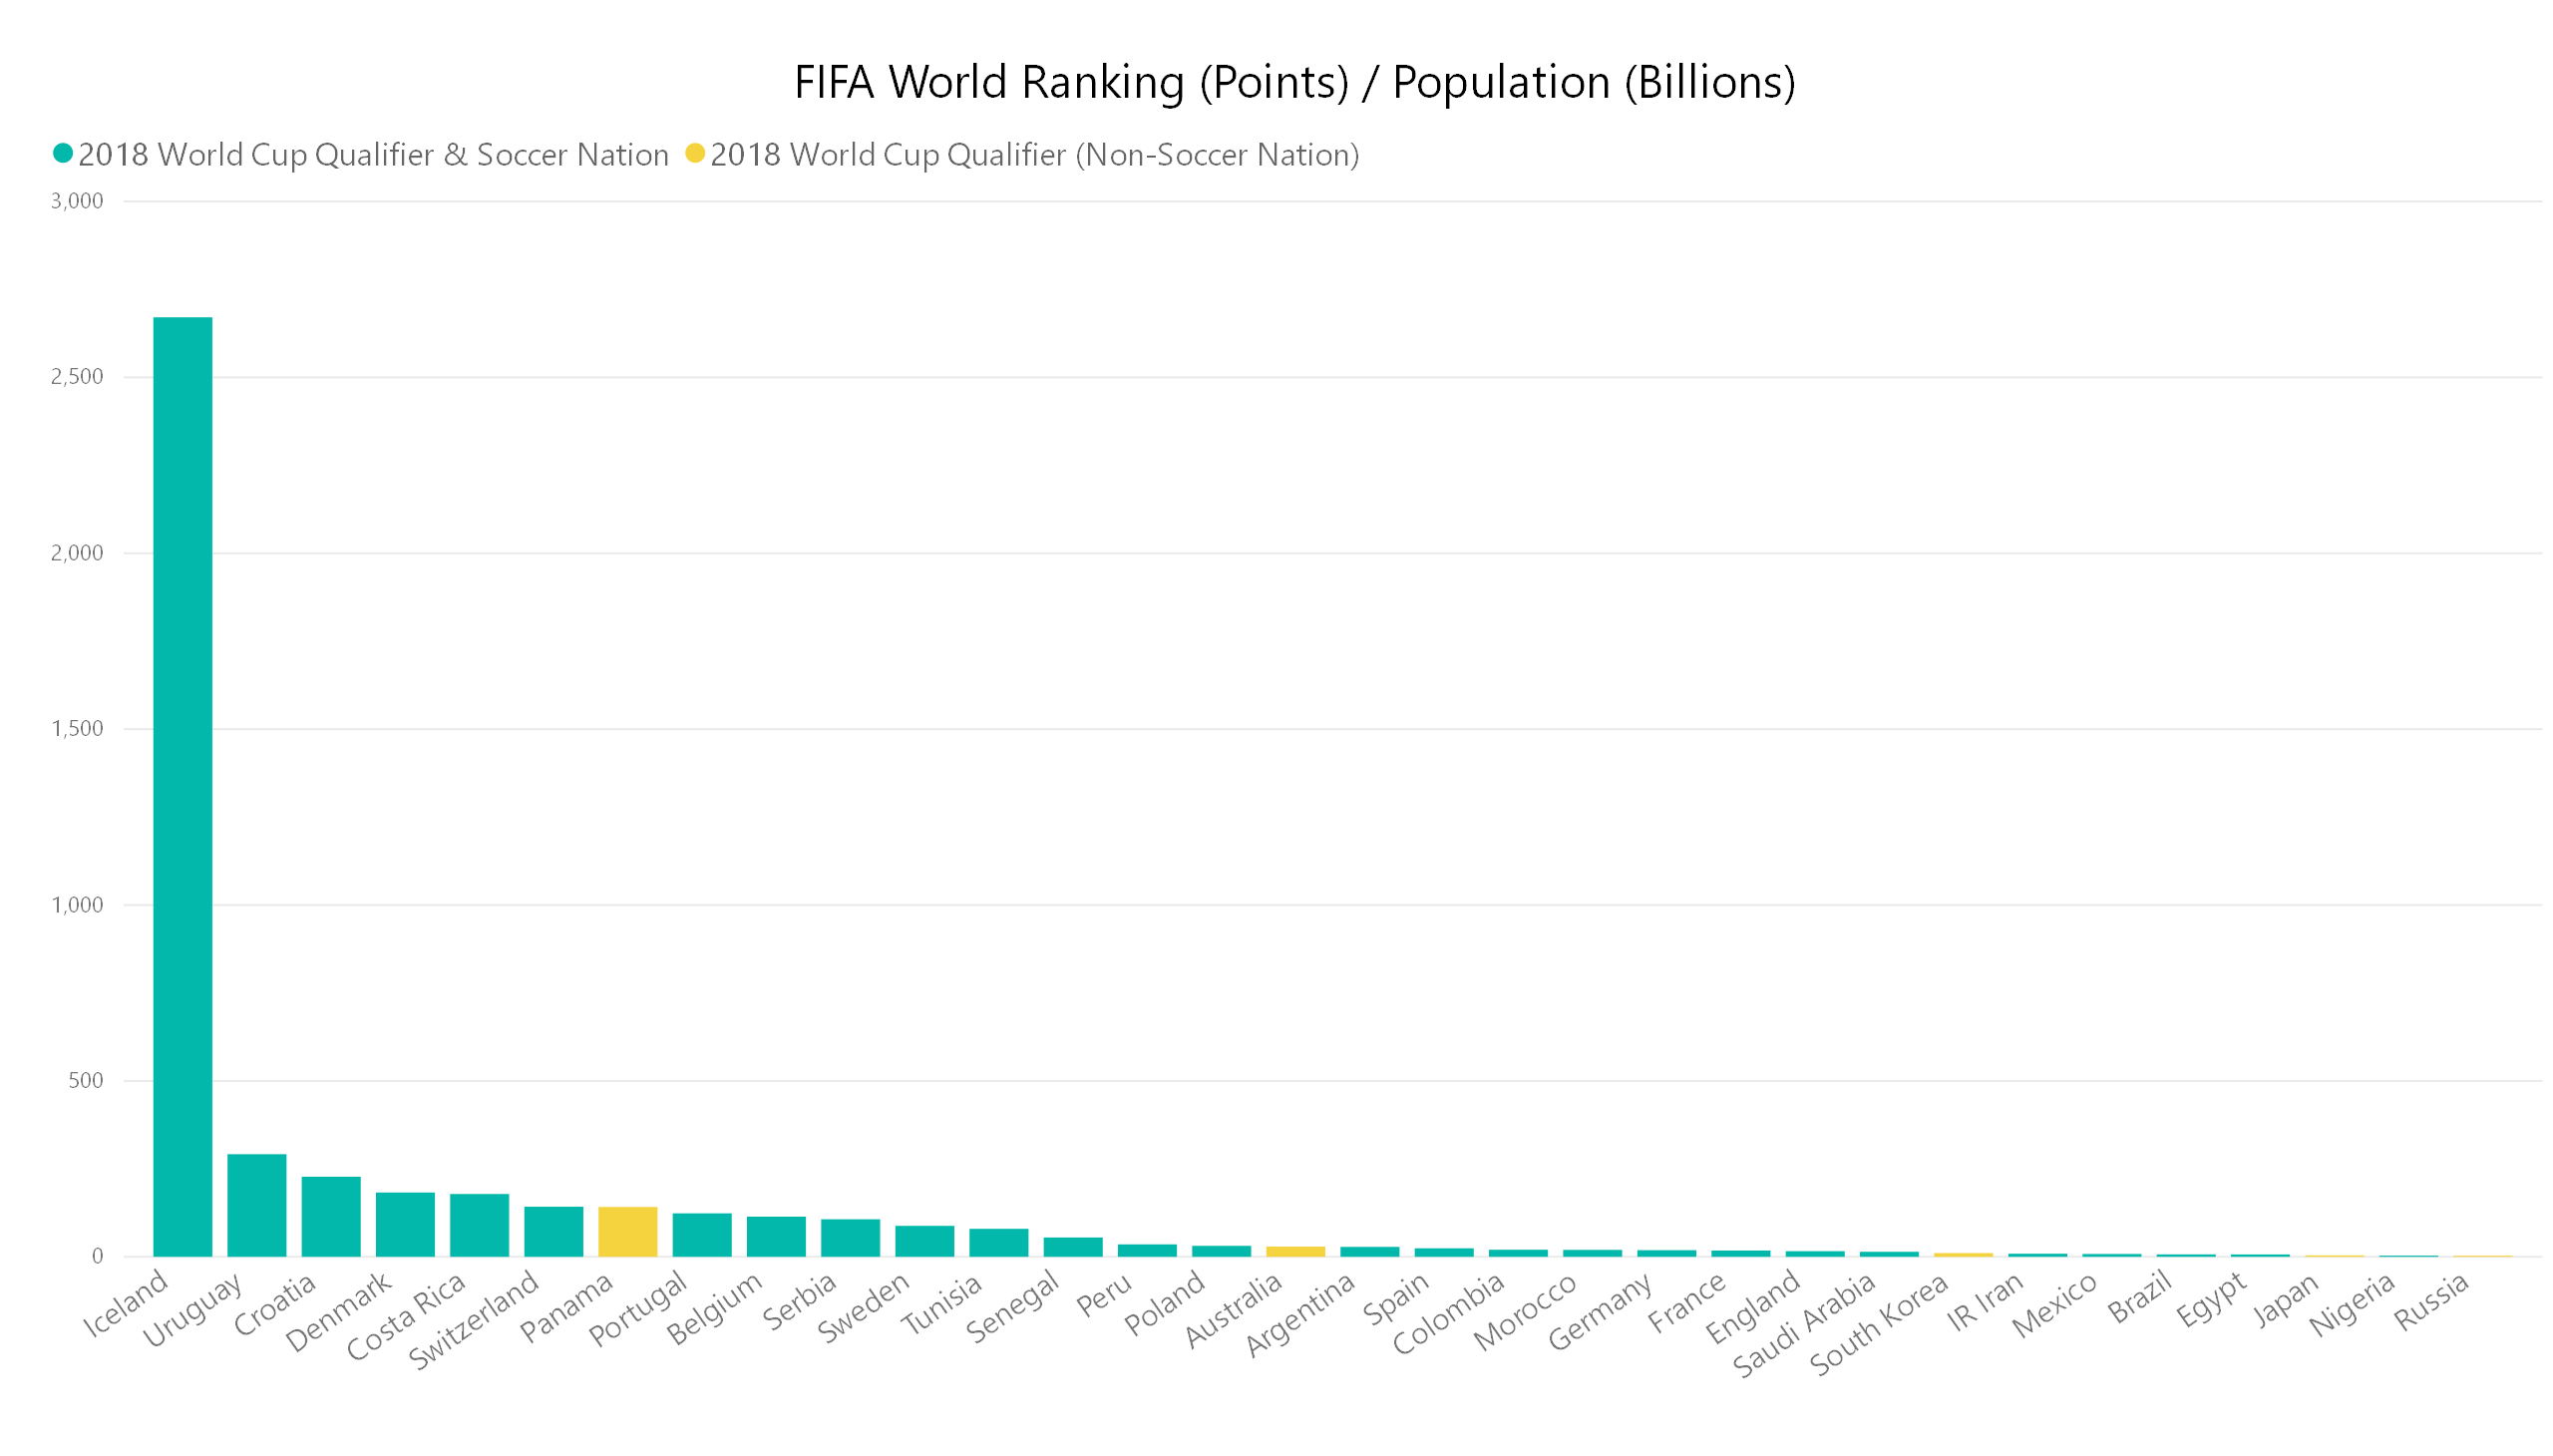
Figure 5- Source: FIFA, Trading Economics
Similar to raw GDP, population seems to be less of an indicator of soccer success. However, Brazil – the most successful team in World Cup history – is the most populated country in the world, with soccer being its national pastime. Nigeria, the largest nation in Africa and a proud soccer nation, is also a country to watch in the coming years.
GDP per Capita
Another way to gauge a country’s soccer success is to divide GDP by population, which produces GDP per capita. We used this value to establish a country’s economic development level and then examined how it relates to their soccer performance. The numbers are intriguing, highlighting countries that punch above their economic development weight class, which may offer insight into what future World Cups will look like (Figure 6).
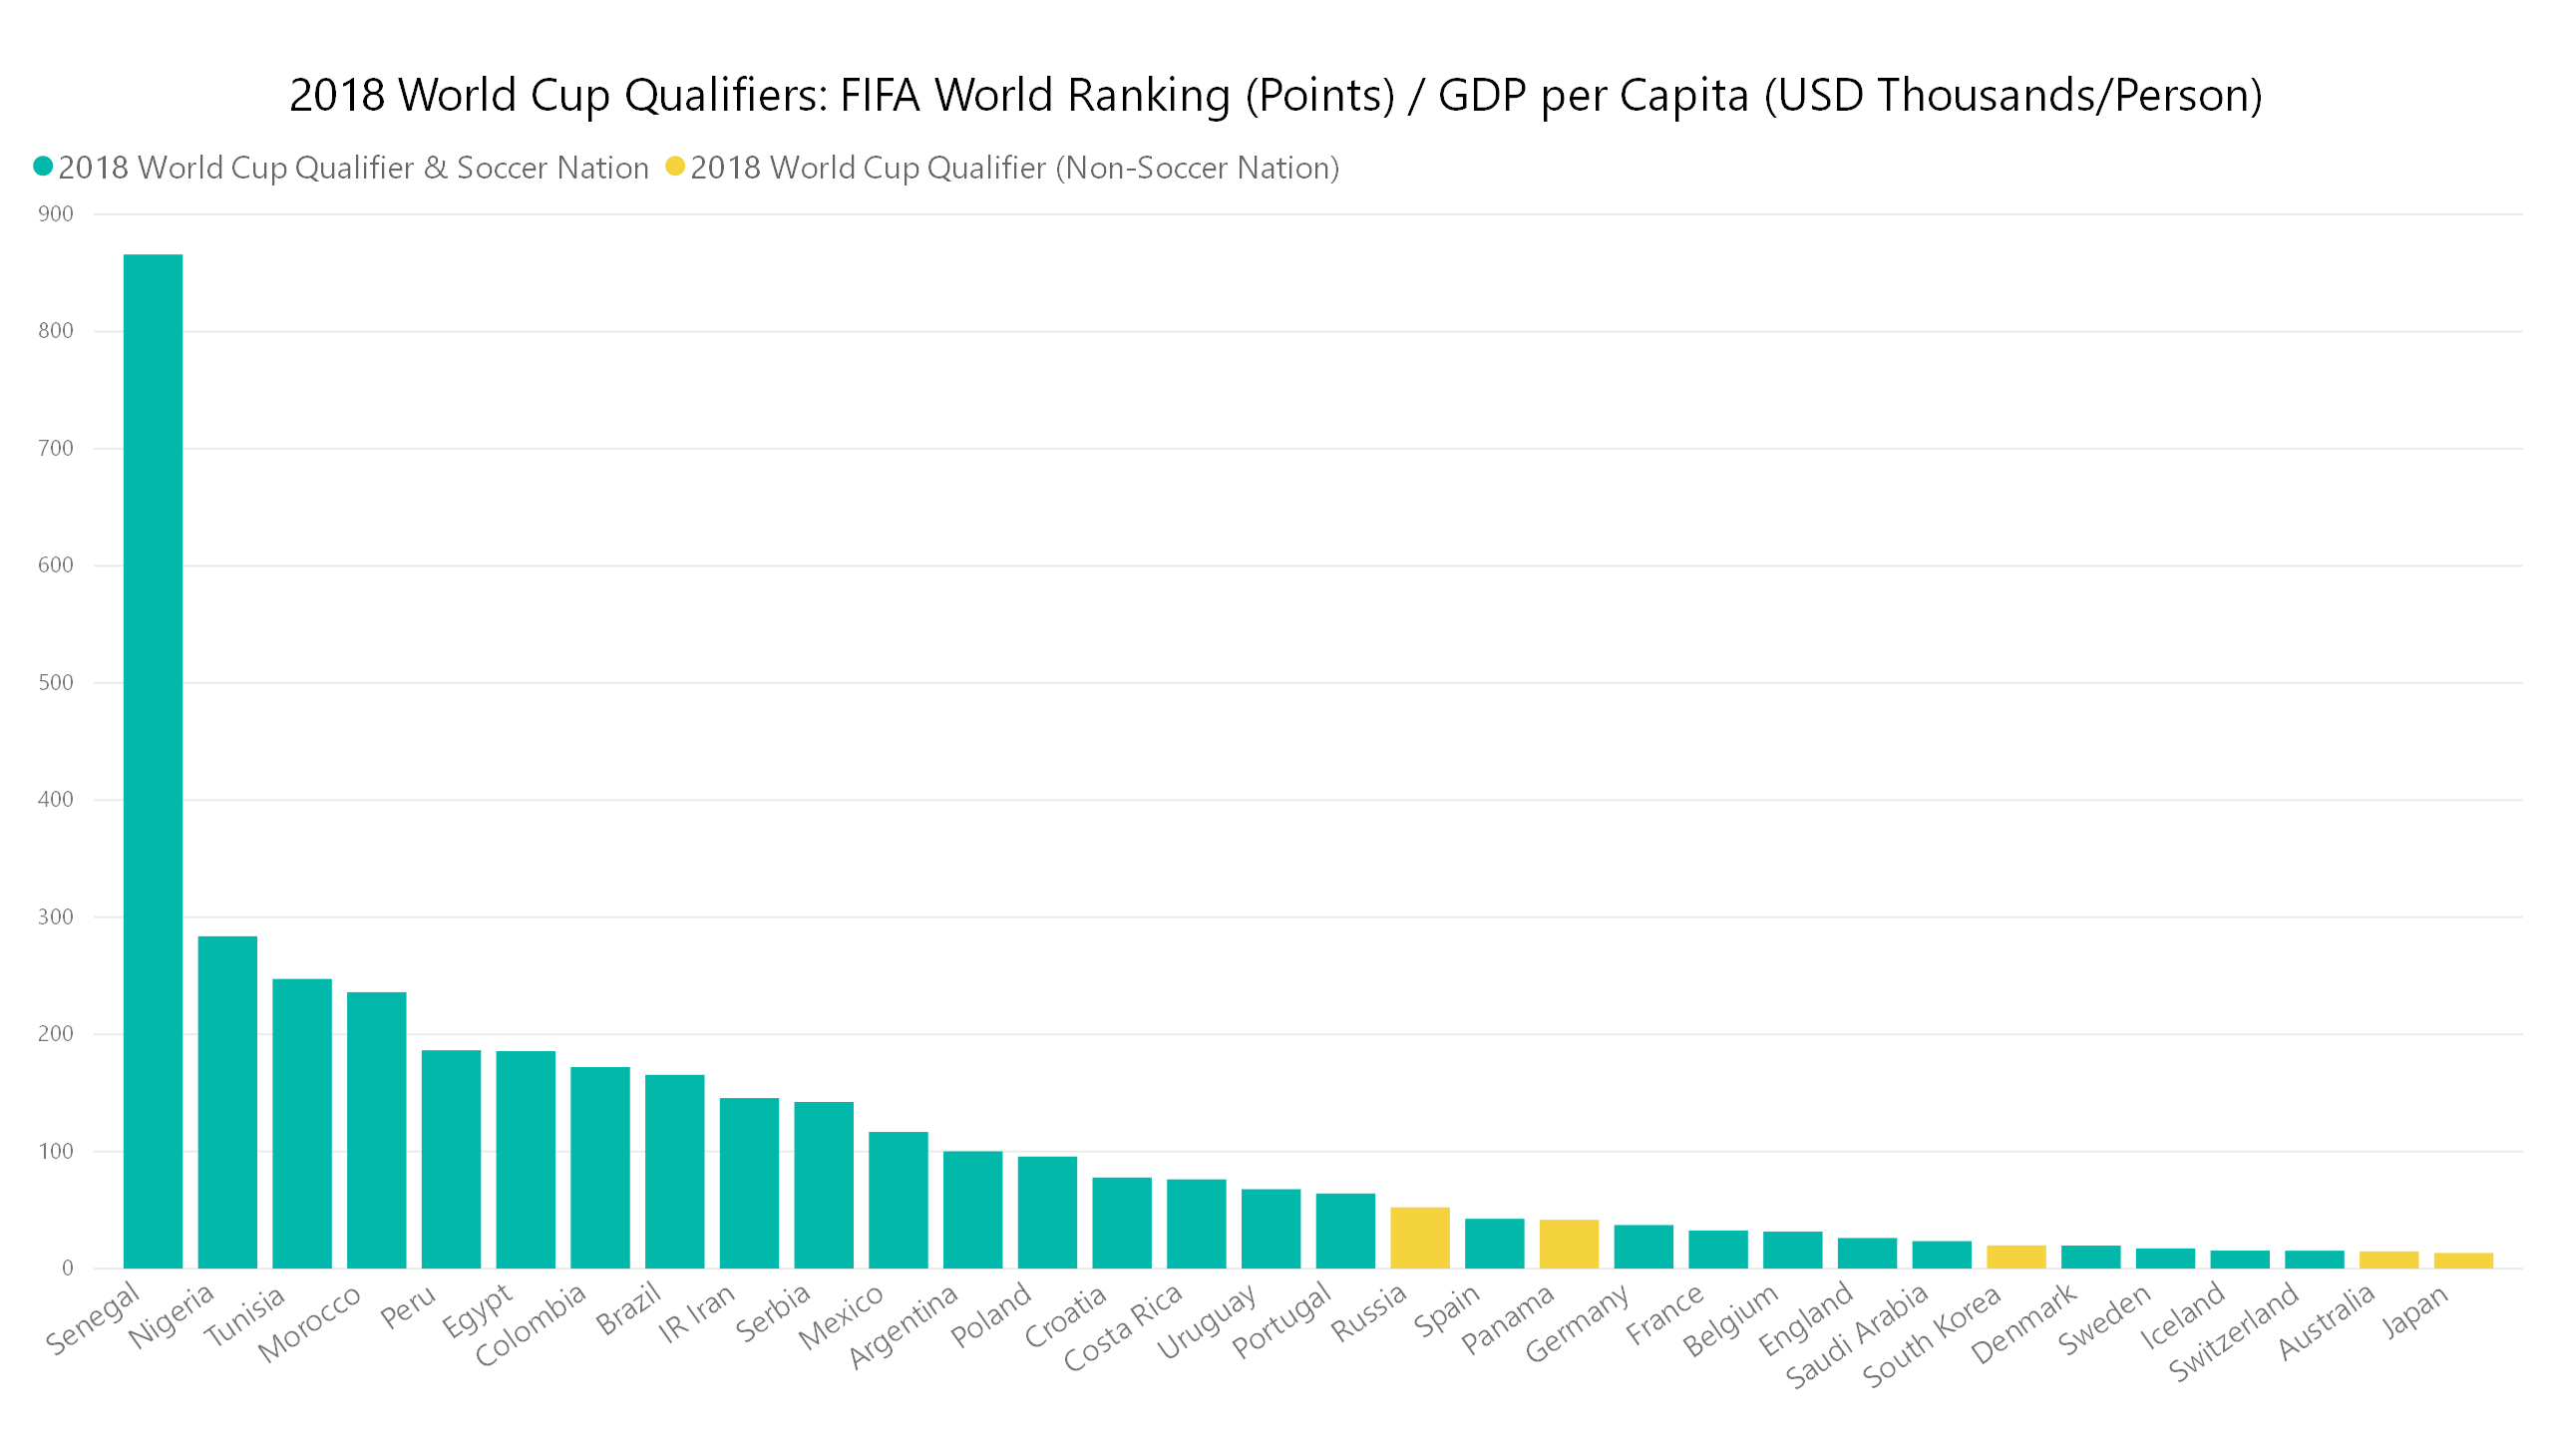
Figure 6- Source: FIFA, Trading Economics
When looking at GDP per capita, there are fewer World Cup qualifiers in the top 45 (14); however, nearly all of the countries are in the top 90, with Iran ranked at 91st. The only nations below Iran are the CAF (Africa) representatives: Tunisia (109), Egypt (113), Morocco (119), Nigeria (126) and Senegal (152). These African nations are in the early stages of economic development and are growing financial markets noticeably.
Market Classifications
While GDP per capita is a simple indicator of the economic development level of a country, the more relevant metric for investment due diligence is the market classification provided by index companies such as MSCI (Morgan Stanley Capital International), FTSE (Financial Times Stock Exchange), S&P (Standard & Poor’s), and Russell. These index companies vary in their details of how they define different inclusions but generally use three buckets to group and index companies: developed, emerging, and frontier markets (Senay, 2017). They represent three different stages of economic development across countries that refer to their investability.
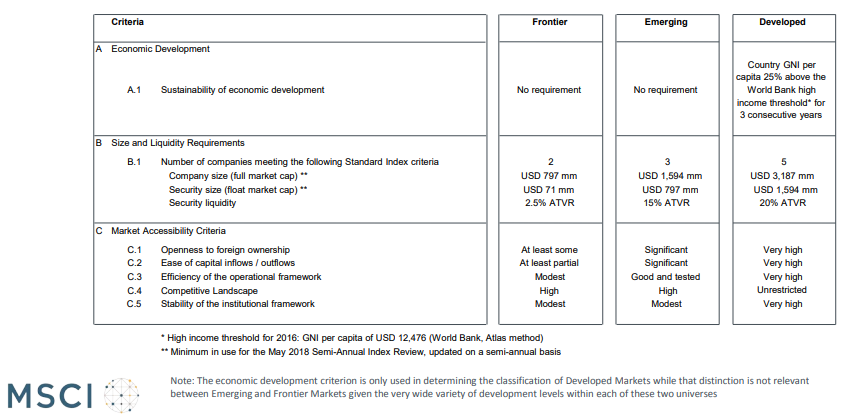
Developed markets are countries with the highest levels of GDP per capita. To become a Developed Market for MSCI, companies on the securities exchange in that country need to meet specific requirements for market capitalization, float (market cap of shares not held by promoters and available for trading) and a measure of liquidity (ATVR, or Annual Traded Value Ratio). In addition, there are qualitative market accessibility criteria such as openness to foreign ownership.
The last group of criteria is based on the value that the World Bank defines as “high” for GNI (gross national income) per capita. MSCI requires that each country has a GNI per capita that’s 25 percent higher than the World Bank’s “high” value for three consecutive years (World Bank, 2017). South Korea is a good example of these three groups of criteria for market classification because it meets all of the quantitative metrics (GNI per capita, market cap, float and liquidity). MSCI chooses not to include South Korea as a developed nation because of qualitative market accessibility criteria – specifically, lack of convertibility of the national currency and restrictions imposed by the local exchange (Taranukha, 2016).
The difference between frontier and emerging markets is solely based on the market accessibility criteria and the size and liquidity requirements, and the distinction between the two is entirely agnostic to GNI per capital (Figure 7). With these market classification basics in mind we can further analyze our soccer nations.
Soccer National Economic Development Analysis
Nigeria, Tunisia, Morocco, Egypt, and Senegal – WAEMU (Western African Economic and Monetary Union) have markets that are classified by MSCI. Morocco, Nigeria, Tunisia, and Senegal, as part of the WAEMU, are represented in MSCI’s frontier index. Egypt is classified as an emerging market by MSCI which demonstrates that the country’s economy is progressing financially and equity capital is available to its citizens.
Inclusion in the emerging market index represents a landmark moment for most countries that achieved this status. MSCI market classification can be a particularly interesting metric because it can differ from a common metric such as GDP per capita, as with Argentina and Egypt (ARG- Frontier, $12k per capita and EGY- Emerging, $3.5k per capita). These metrics highlight corruption issues and the lack of rule of law that exists in Argentina. In fact, Argentina has previously been included in the emerging markets index by MSCI, and it was recently announced that the country will be re-included in MSCI’s emerging market index in the near future thanks to policy progress. Figure 6 highlights the soccer success potential in these frontier countries that have a passion for the game. If these nations continue their economic development trajectory, they should become more prominent on the global stage.
This year’s teams are made up of 12 developed, 9 emerging, 8 frontier and 3 unclassified countries, according to MSCI. If unclassified countries are included in frontier, there is a balance between the three levels of financial market sophistication. The unclassified countries – Iran, Costa Rica, Uruguay – are not included by MSCI but are for country size or governance issues within their countries. Their GDP per capita levels are higher than all of their Africa peers that are classified by MSCI. If we combined a country’s market classification and GDP per capita qualitatively, it is fair to say that being either a top 100 economy (GDP per capita) or gaining classification as a frontier market is necessary to finance and dedicate resources sufficient to manage a proper football side. Figure 8 highlights the classifications of the 2018 World Cup Qualifiers.
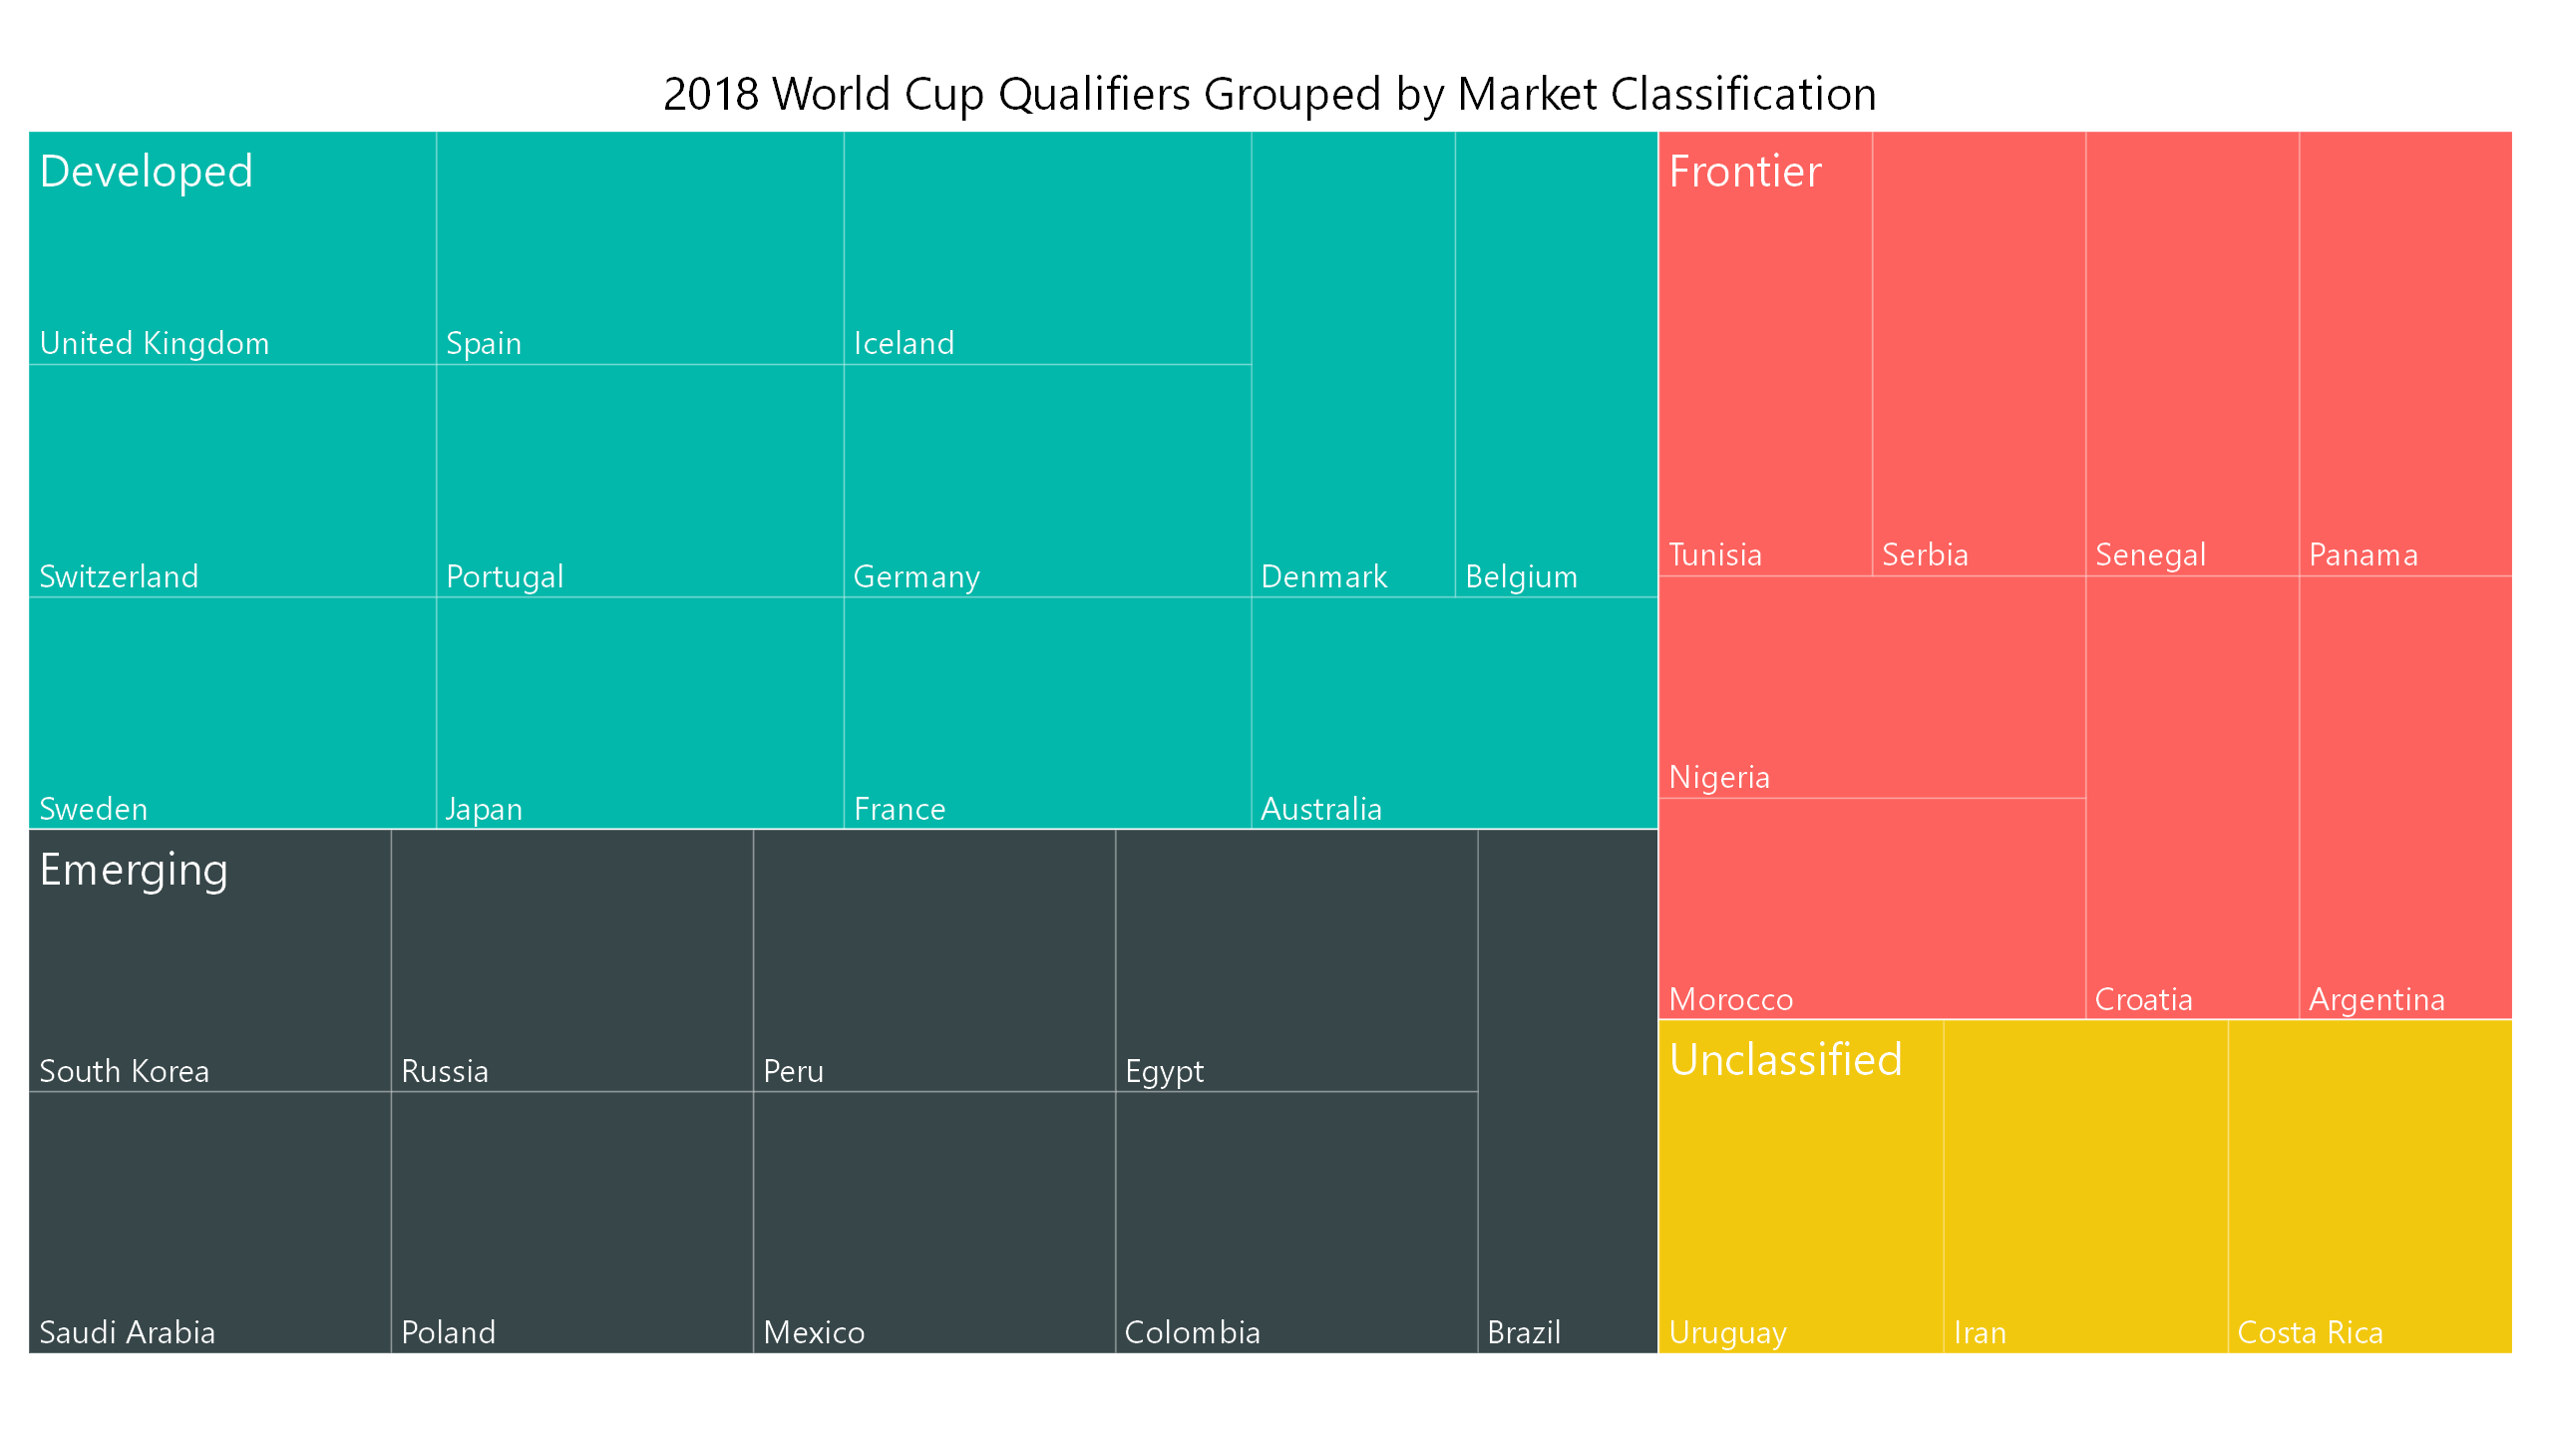
Figure 8- Source: FIFA, MSCI
A country’s financial sophistication doesn’t need to be classified as a developed or even emerging market to have World Cup success. In this year’s tournament the knockout round of 16 will have 3 frontier, 4 emerging and 9 developed market countries with favorites in all three classifications.
Another commonality outstanding amongst these World Cup-qualified nations is that soccer is their favorite sport. Mapping out the world according to most popular sport is done qualitatively and can be difficult for some countries (Sporting Intelligence, 2017). For example, Japan and South Korea both have zealous soccer and baseball fans. Even in parts of the U.S. there are standout soccer cities such as Seattle and Portland where MLS sellouts are the norm. In countries where there is a clear plurality of sporting interest we opted to list the non-soccer sport to highlight the importance of “soccer maximalism” to soccer success at the highest level (Figure 9). Soccer maximalism is where soccer is the number one sport in that country. In most cases those nations don’t care about other sports other than soccer. It is this passion for the sport that is so prevalent in South America, Africa, and parts of Europe, and is highly correlated with success on the pitch.

Figure 9- Source: Sporting Intelligence, Tyler Scott
If we combine the criteria for a minimum level of economic development and national soccer passion, what’s left are soccer nations that have the potential to compete for the golden globe, now and in the future. Figure 10- which evaluates those countries that have the highest FIFA World Ranking/GDP per capita – shows that several soccer nations (primarily from Africa, but also Eastern Europe and the Americas) have potential to improve their soccer results if they continue to develop economically. Particularly interesting is the Democratic Republic of the Congo (formerly Zaire) which is the 19th most populated country in the world (78.74 million) and is ranked 39th in the world by FIFA. This country currently has a GDP per capita of approximately $440 per person per year and is projected to become the 10th most populated country in the world by 2050 (United Nations, 1999).
It is the soccer nations with economic growth potential and a reasonable population that may be competitive with the historic soccer powerhouses. This trend has occurred in South America with the rise of Colombia, Peru and Chile to the highest levels of FIFA rankings. These countries will likely maintain their position as elite soccer nations as they continue their economic development, largely due to the soccer obsession that exists across the continent. The same may occur in Europe and some Asian nations that focus on soccer as their national passion. However, some European nations will be limited by population and susceptible to the cyclical nature of developing premier players from a limited base. Ukraine and Poland stand out as developing European nations that have sufficient populations to become successful at World Cup competition.
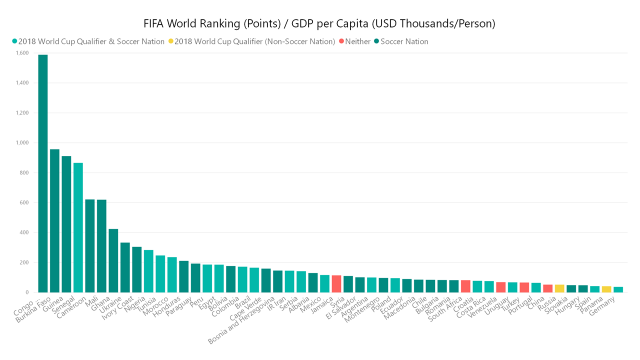
Figure 10- Source: FIFA, Trading Economics
In reviewing the data, it’s clear that a country must be obsessed with soccer if it is going to have a shot at the World Cup. In the FIFA World Ranking Top 75 nations, 61 of them (81 percent) are passionate soccer nations (Figure 11). If we look at that same group of 75 and categorize them by their market classification we observe:
22 developed countries
16 emerging countries
15 frontier countries
21 unclassified countries
(Figure 12)
The diversity of market classifications highlight how African, European and South/Central American nations can improve the quality of their football side. It also means that the chances of the U.S hoisting the World Cup trophy are slim. Unless a large population within our country becomes fanatical about soccer – at both the youth and professional level – it will be difficult to overcome the tailwinds that less economically developed competitors have. With the World Cup officially coming to North America in 2026 with an expanded tournament of 48 teams, we will have the chance to see many of these dynamics play out in person.
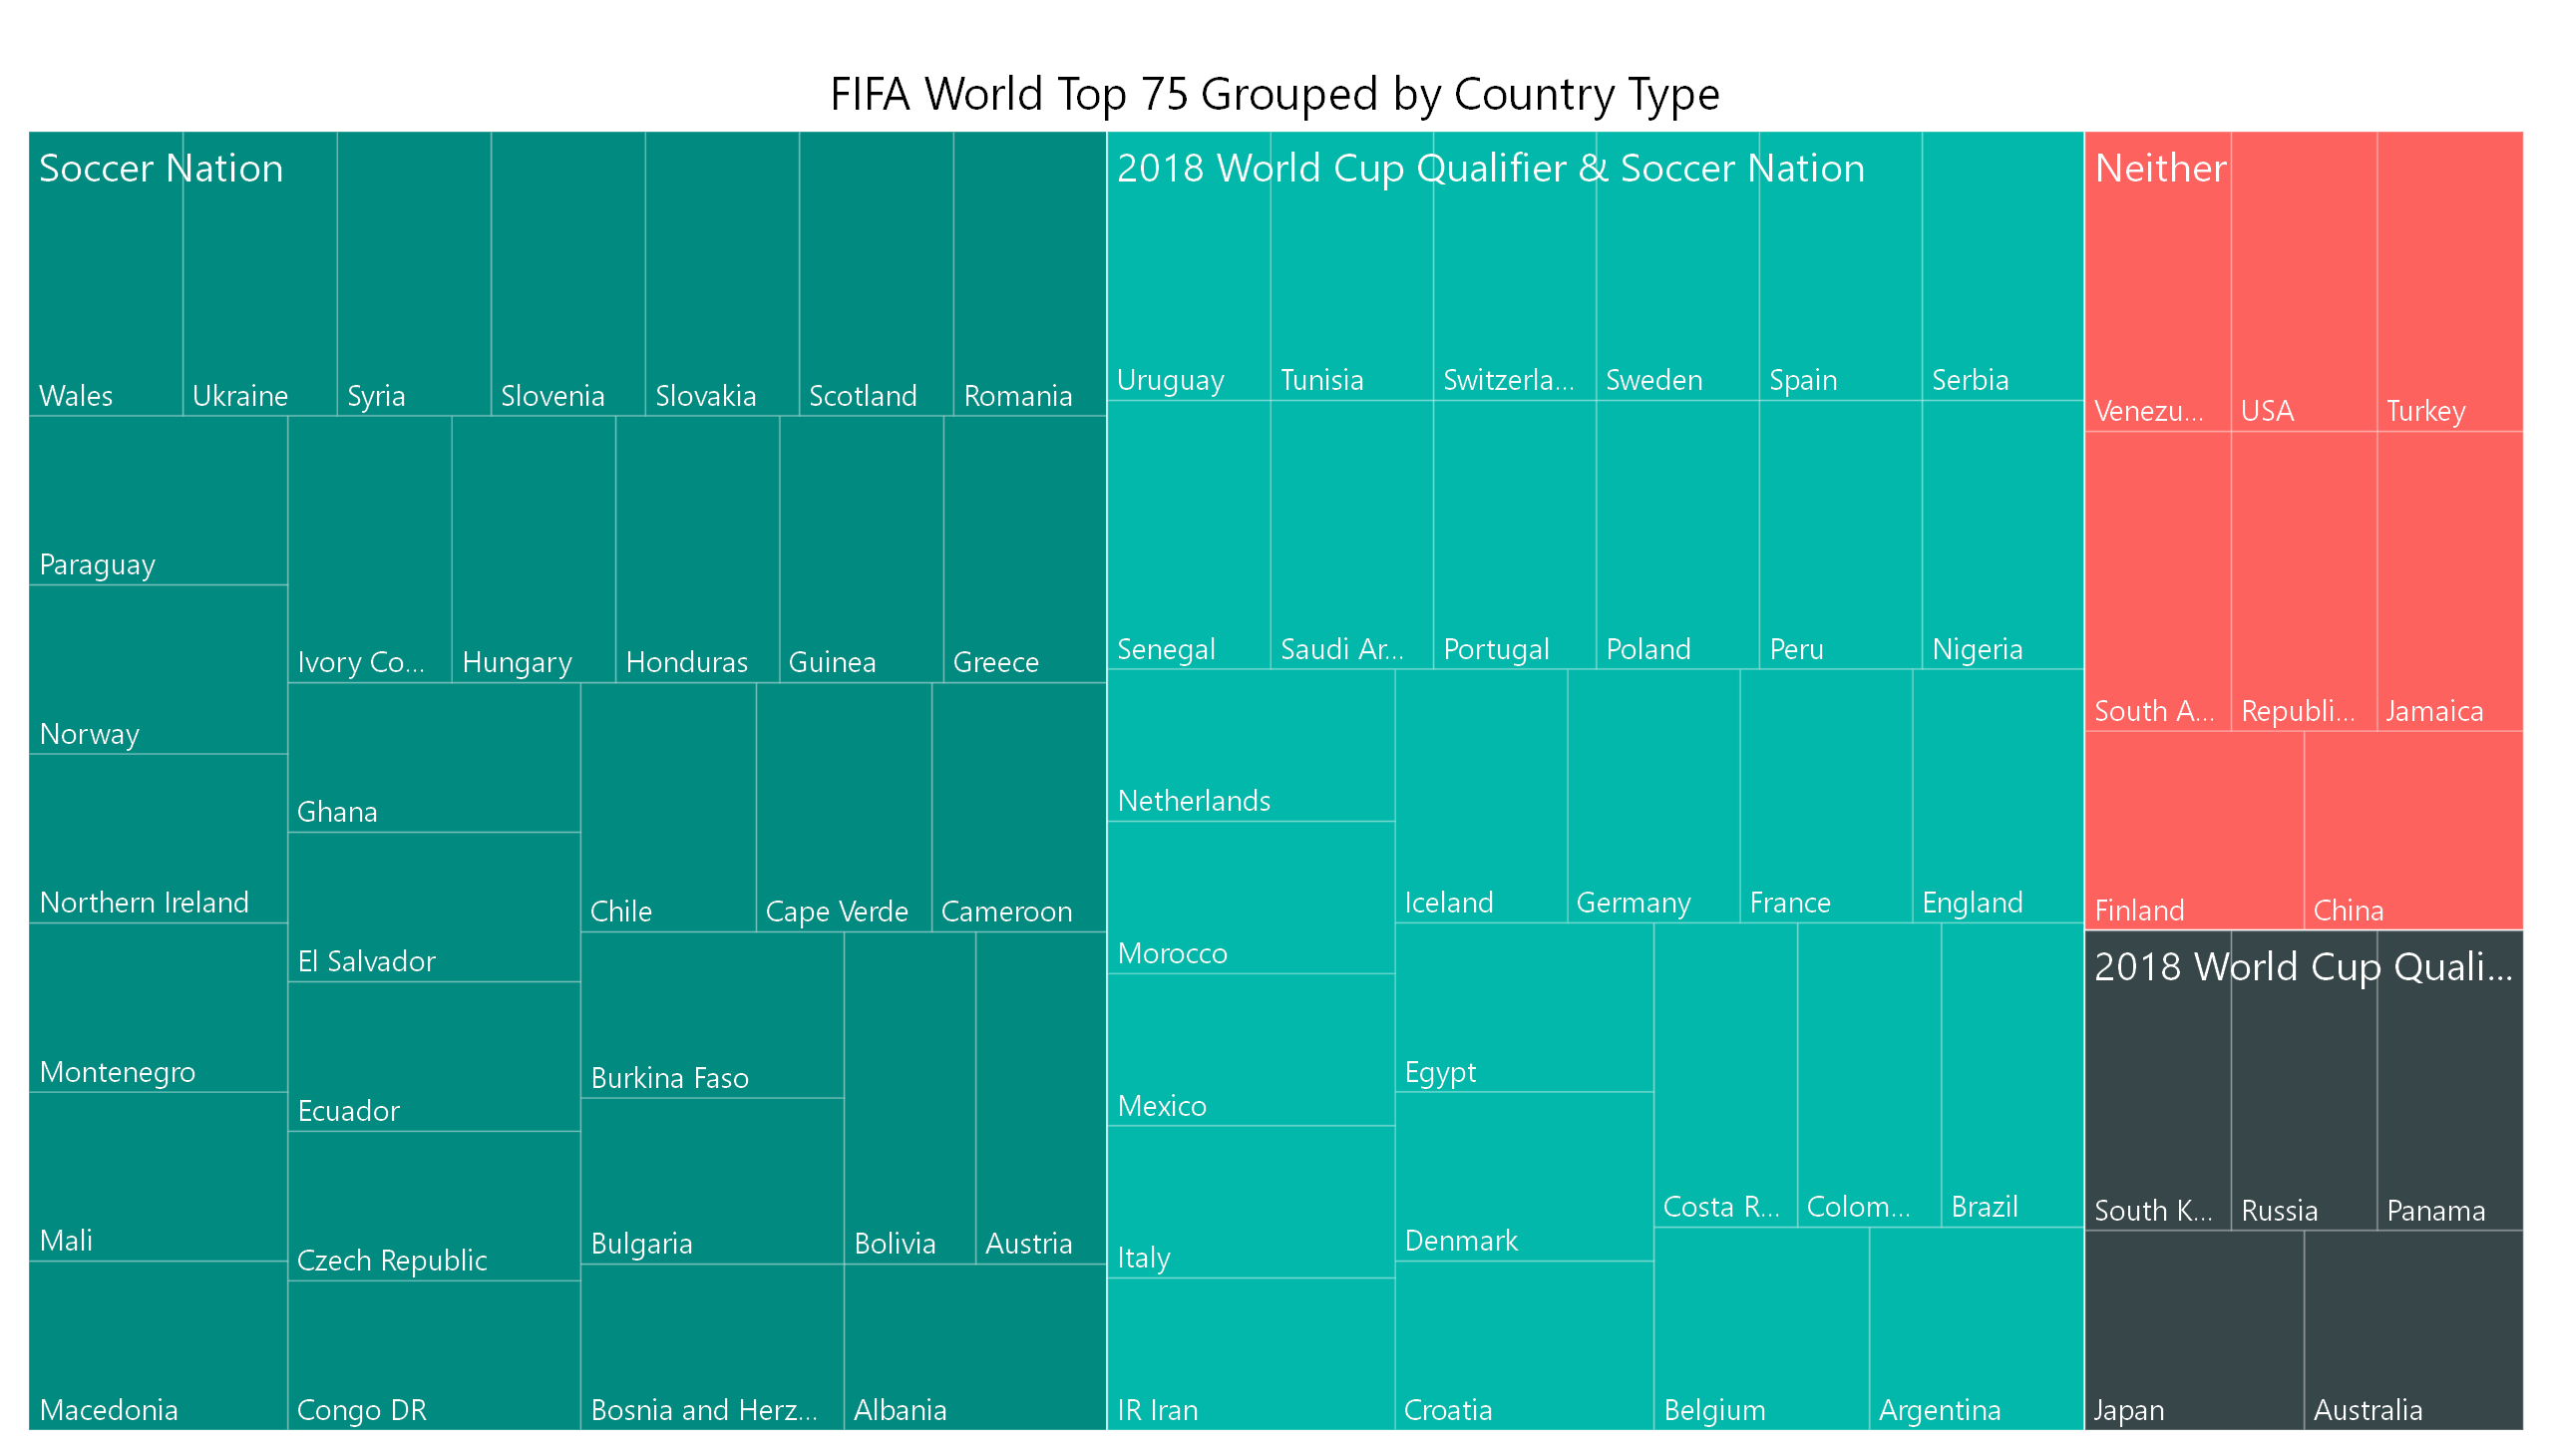
Figure 11- Source: FIFA, Tyler Scott

Figure 12- Source: FIFA, MSCI
Tyler Scott
Research Analyst
Tyler creates technology tools that provide insight and clarity to Versant Capital Management’s investment and wealth management processes and systems.
Figure 1- Source: FIFA
Figure 2- Source: Trading Economics
Figure 3- Source: FIFA, Trading Economics
Figure 4- Source: Trading Economics
Figure 5- Source: FIFA, Trading Economics
Figure 6- Source: FIFA, Trading Economics
Figure 7- Source: MSCI
Figure 8- Source: FIFA, MSCI
Figure 9- Source: Sporting Intelligence, Tyler Scott
Figure 10- Source: FIFA, Trading Economics
Figure 11- Source: FIFA, Tyler Scott
Figure 12- Source: FIFA, MSCI
References
Decierdo, R. (2017, January 11). China Loves Sports, Big Data Reveals. Retrieved from Yibada: http://en.yibada.com/articles/185185/20170111/china-loves-sports-big-data-reveals.htm
FIFA. (2018, June 7). FIFA World Ranking. Retrieved from FIFA: https://www.fifa.com/fifa-world-ranking/ranking-table/men/index.html
MSCI. (2018, May 31). Enhanced Index Module.
MSCI. (2018, May). MSCI Market Classification Framework. Retrieved from MSCI: https://www.msci.com/documents/1296102/1330218/Market+Classification+Consultation+%28Final%29.pdf/081f2dcb-f2f5-a93b-f529-0b5aaa5847d5
Senay, R. (2017, September 14). Introduction to Frontier Markets. Retrieved from Lazard Asset Management: http://www.lazardnet.com/docs/sp0/19582/IntroductionToFrontierMarkets
Sporting Intelligence. (2017, january 5). Best attended domestic sports leagues in the world. Retrieved from Sporting Intelligence: http://www.sportingintelligence.com/finance-biz/business-intelligence/global-attendances/
Taranukha, A. (2016, October 20). Why South Korea Remains Classified As An Emerging Market. Retrieved from Frontera: https://frontera.net/news/asia/emerging-markets-investment-in-south-korea-a-market-with-characteristics-similar-to-developed-markets/
Trading Economics. (2018, May 31). Retrieved from https://tradingeconomics.com/
United Nations. (1999). The twenty most populous countries in 1950,1999 and 2050. Retrieved from UN.org: http://www.un.org/esa/population/pubsarchive/india/20most.htm
World Bank. (2017). GNI per capita, Atlas Method (current US$). Retrieved from World Bank: https://data.worldbank.org/indicator/NY.GNP.PCAP.CD?end=2017&start=1962&view=chart
[mk_fancy_text color=”#444444″ highlight_color=”#ffffff” highlight_opacity=”0.0″ size=”14″ line_height=”21″ font_weight=”inhert” margin_top=”0″ margin_bottom=”14″ font_family=”none” align=”left”]Disclosure: Please remember that past performance may not be indicative of future results. Different types of investments involve varying degrees of risk, and there can be no assurance that the future performance of any specific investment, investment strategy, or product (including the investments and/or investment strategies recommended or undertaken by Versant Capital Management, Inc.), or any non-investment related content, made reference to directly or indirectly in this article will be profitable, equal any corresponding indicated historical performance level(s), be suitable for your portfolio or individual situation, or prove successful. Due to various factors, including changing market conditions and/or applicable laws, the content may no longer be reflective of current opinions or positions. Moreover, you should not assume that any discussion or information contained in this article serves as the receipt of, or as a substitute for, personalized investment advice from Versant Capital Management, Inc. To the extent that a reader has any questions regarding the applicability of any specific issue discussed above to his/her individual situation, he/she is encouraged to consult with the professional advisor of his/her choosing. Versant Capital Management, Inc. is neither a law firm nor a certified public accounting firm and no portion of the article content should be construed as legal or accounting advice. If you are a Versant Capital Management, Inc. client, please remember to contact Versant Capital Management, Inc., in writing, if there are any changes in your personal/financial situation or investment objectives for the purpose of reviewing/evaluating/revising our previous recommendations and/or services. A copy of the Versant Capital Management, Inc.’s current written disclosure statement discussing our advisory services and fees is available upon request.[/mk_fancy_text][/vc_column_text][/vc_column][/vc_row]