[mk_fancy_title tag_name=”h1″ size=”30″ line_height=”24″ color=”#69725d” font_weight=”inherit” letter_spacing=”0″ margin_bottom=”10″ align=”left”]
Introducing: Versant Monthly Market Reports
[/mk_fancy_title]
With people being bombarded by financial news on a daily basis, investors may find it difficult to separate “noise” from important changes in the markets, making it easy to lose sight of your big investment picture. Events such as the recent Brexit vote or Japan’s 2011 earthquake can create periods of excess market volatility, but the long-term effect may be minimal.
To help every stakeholder focus on the big picture, Versant Capital Management is now bringing you a monthly market report that highlights the returns of major equity and fixed income indexes. These indexes are grouped using Versant’s own classification terminology (global growth, deflationary, etc.) to give you a better sense of how the report relates to your own investment portfolio. One-month index returns will be reported alongside one, five, and ten year return data to provide much needed perspective. For example, you can now assess whether Puerto Rican defaults greatly affected the municipal bond market (the answer is no!) or how value stocks have performed relative to growth stocks. Perspective is important and key to a sound investment process.
We hope you learn and understand more about your investment portfolio from these monthly reports. As always, we look forward to your feedback.
Monthly Market Report: July 2016

Commentary- For the month of July, all broad developed market indices posted positive returns. The Pacific region recorded the highest return while the United Kingdom and Canada had the lowest returns. International developed markets outperformed the United States’ market by approximately 1.2%. Fallout from the Brexit vote mitigated U.K. market gains, but the markets of other European countries rebounded strongly.
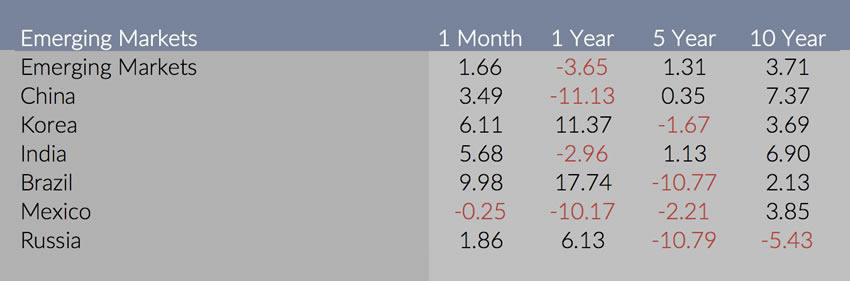
Commentary- Emerging markets as a whole recorded positive returns. Brazil posted a strong return of 9.98%. China had a modest gain of 3.49%, reducing some of the losses over the past year. Mexico’s struggles continued as its market recorded a slight negative return of -0.25%.
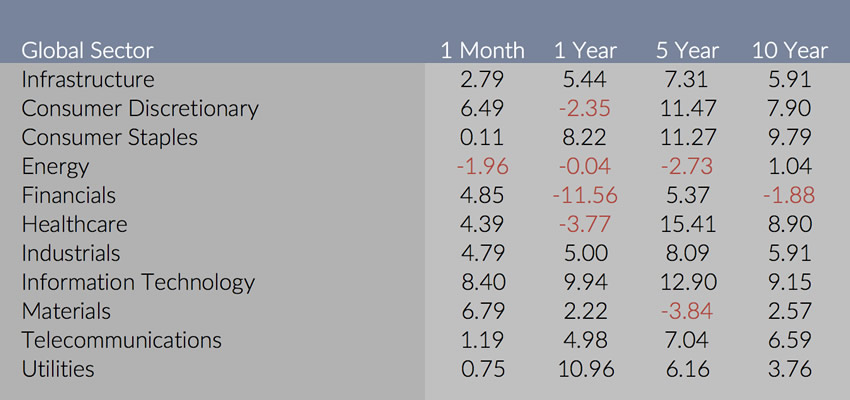
Commentary- Information technology, materials, and consumer discretionary posted the strongest global sector returns of 8.4%, 6.79%, and 6.49%, respectively. Energy’s struggles continued as the sector posted a negative return of approximately 2%. While consumer staples and utilities were essentially flat for the month, their one year returns are still outpacing most other sectors.
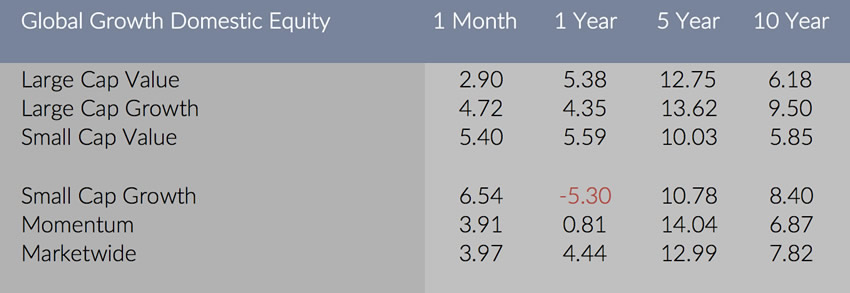
Commentary- For the month of July, domestic growth indices outperformed value indices across all market capitalization ranges. However, growth still lags value over the past year. Small cap value has performed considerably better than small cap growth in the trailing one year period.
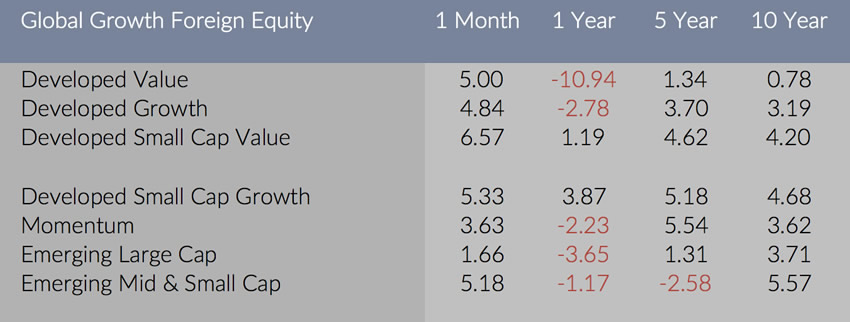
Commentary- In the international developed markets, value indices outperformed growth indices. Value’s outperformance was the greatest in the small cap space. Emerging market small cap and mid cap stocks posted higher returns than large cap stocks over the past one month and year periods. Momentum returned 3.63% for the month of July.
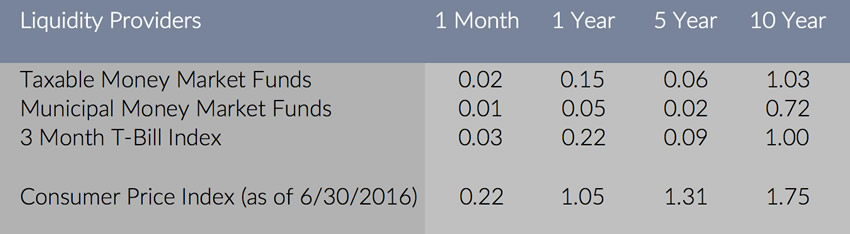
Commentary- Money market funds continue to have very low yields, performing in line with the 3 month T-Bill Index. The yields fail to keep pace with changes in the Consumer Price Index.
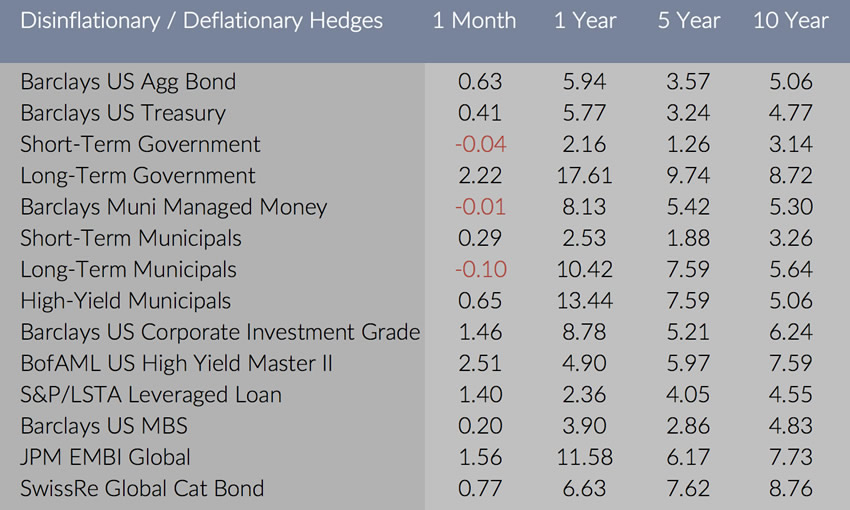
Commentary- The majority of deflationary hedges posted positive returns for the month. High yield bonds and long-term government bonds produced the highest returns of 2.51% and 2.22%, respectively. The higher returns are rewards for taking on more credit risk (high yield) and interest rate risk (long-term government). The emerging market bond index, JPM EMBI Global, also recorded moderate gains.
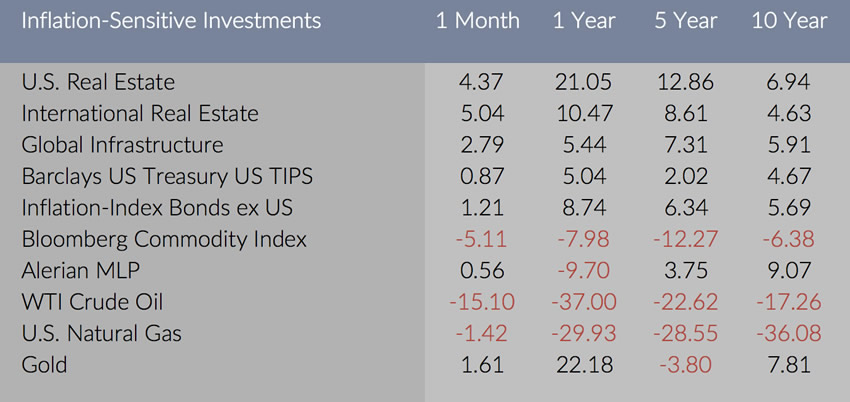
Commentary- Real estate posted strong returns in the month of July with international real estate slightly outpacing the U.S. market. The Bloomberg Commodity Index took a hit of 5.11%, primarily due to the index’s 31% energy weighting. Gold continued its strong 2016 with a modest 1.61% return.
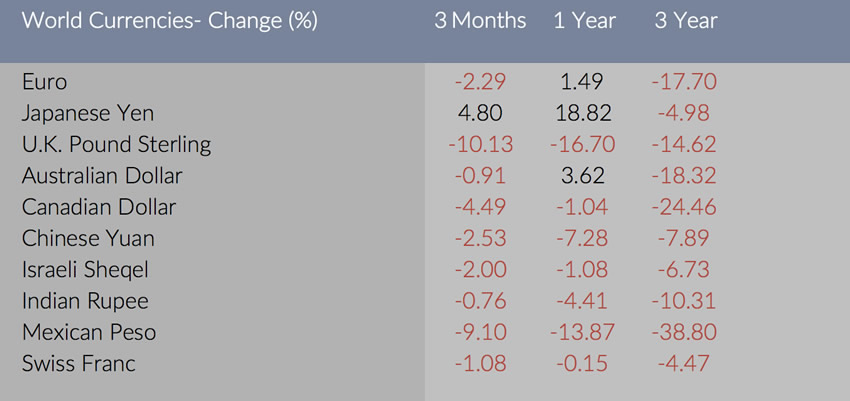
Commentary- Over the past three months, the U.S. dollar appreciated against most other major currencies except for the Japanese Yen. The Pound depreciated the most as a result of the Brexit vote. .
[mk_fancy_text highlight_color=”#ffffff” highlight_opacity=”0.0″ size=”14″ line_height=”17″ font_weight=”inhert” margin_top=”0″ margin_bottom=”18″ font_family=”none” align=”left”]Disclosures: Sources- Morningstar and ratesfx.com. Past performance is not a guarantee of future results. Indices are not available for direct investment. Index performance does not reflect the expenses associated with the management of an actual portfolio. Market segment (index representation) as follows: International Developed (MSCI World ex USA), United States (MSCI USA), Canada (MSCI Canada), Europe ex UK (MSCI Europe ex UK), United Kingdom (MSCI United Kingdom), Pacific ex Japan (MSCI Pacific ex Japan), Japan (MSCI Japan), Emerging Markets (Morningstar MSCI Emerging Markets), China (MSCI China), Korea (MSCI Korea), India (MSCI India), Brazil (MSCI Brazil), Mexico (MSCI Mexico), Russia (MSCI Russia), Infrastructure (S&P Global Infrastructure), Consumer Discretionary (S&P Global 1200 Consumer Discretionary Sector), Consumer Staples (S&P Global 1200 Consumer Staples Sector), Energy (S&P Global 1200 Energy Sector), Financials (S&P Global 1200 Financials), Healthcare (S&P Global 1200 Healthcare Sector), Industrials (S&P Global 1200 Industrials), Information Technology (S&P Global 1200 Information Technology Sector), Materials (S&P Global 1200 Materials Sector), Telecommunications (S&P Global 1200 Telecom Sector), Utilities (S&P Global 1200 Utilities Sector), Large Cap Value (Russell 1000 Value), Large Cap Growth (Russell 1000 Growth), Small Cap Value (Russell 2000 Value), Small Cap Growth (Russell 2000 Growth), Momentum (Domestic, MSCI USA Barra Momentum), Marketwide (Russell 3000), Developed Value (MSCI World ex USA Value), Developed Growth (MSCI World ex USA Growth), Developed Small Cap Value (MSCI World ex USA Small Value), Developed Small Cap Growth (MSCI World ex USA Small Growth), Momentum (Foreign, MSCI World ex US Momentum), Emerging Large Cap (Morningstar MSCI Emerging Markets), Emerging Mid & Small Cap (MSCI Emerging Markets SMID), Taxable Money Market Fund (Morningstar Taxable Money Market AW), Municipal Money Market Fund (Morningstar Tax-Free Money Market AW), 3 Month T-Bill Index (BofAML US Treasury Bill 3 Mon), Consumer Price Index (US BLS CPI All Urban SA 1982-1984), Short-term government (Barclays Government 1-5 Yr.), Long-term government (Barclays US Government Long), Short-term municipals (Barclays Muni 1-5 Yr. Blend(1-6)), Long-term municipals (Barclays Municipal Long 22+ Yr.), High-yield municipals (Barclays HY Muni), U.S Real Estate (DJ US Select REIT), International Real Estate (DJ Gbl Ex US Select REIT), Global Infrastructure (S&P Global 1200 Infrastructure), WTI Crude Oil (Bloomberg Sub WTI Crude Oil), U.S. Natural Gas (Bloomberg Sub Natural Gas), Gold (LBMA Gold Price PM USD)[/mk_fancy_text]